This tutorial will show you how to publish temperature and humidity sensor data via MQTT from esp32(DHT11) to Node-Red, Influx DB and Grafana on ec2 instance one step at a time, sounds interesting let’s start.
Overview
In this tutorial we will be publishing temperature and humidity sensor data from esp32(DHT11) sensor via Mosquitto MQTT with the esp32 to Node-Red, Influx DB and Grafana in ec2 instance AWS.
Goals
- Creating EC2 instance.
- Installing Mosquitto MQTT, Node-Red, Influx DB and Grafana on ec2 instance.
- Sending data from DHT11 sensor via Mosquitto MQTT with esp32 to Node-Red, Influx DB, and Grafana.
Creating EC2 Instance
Step 1:
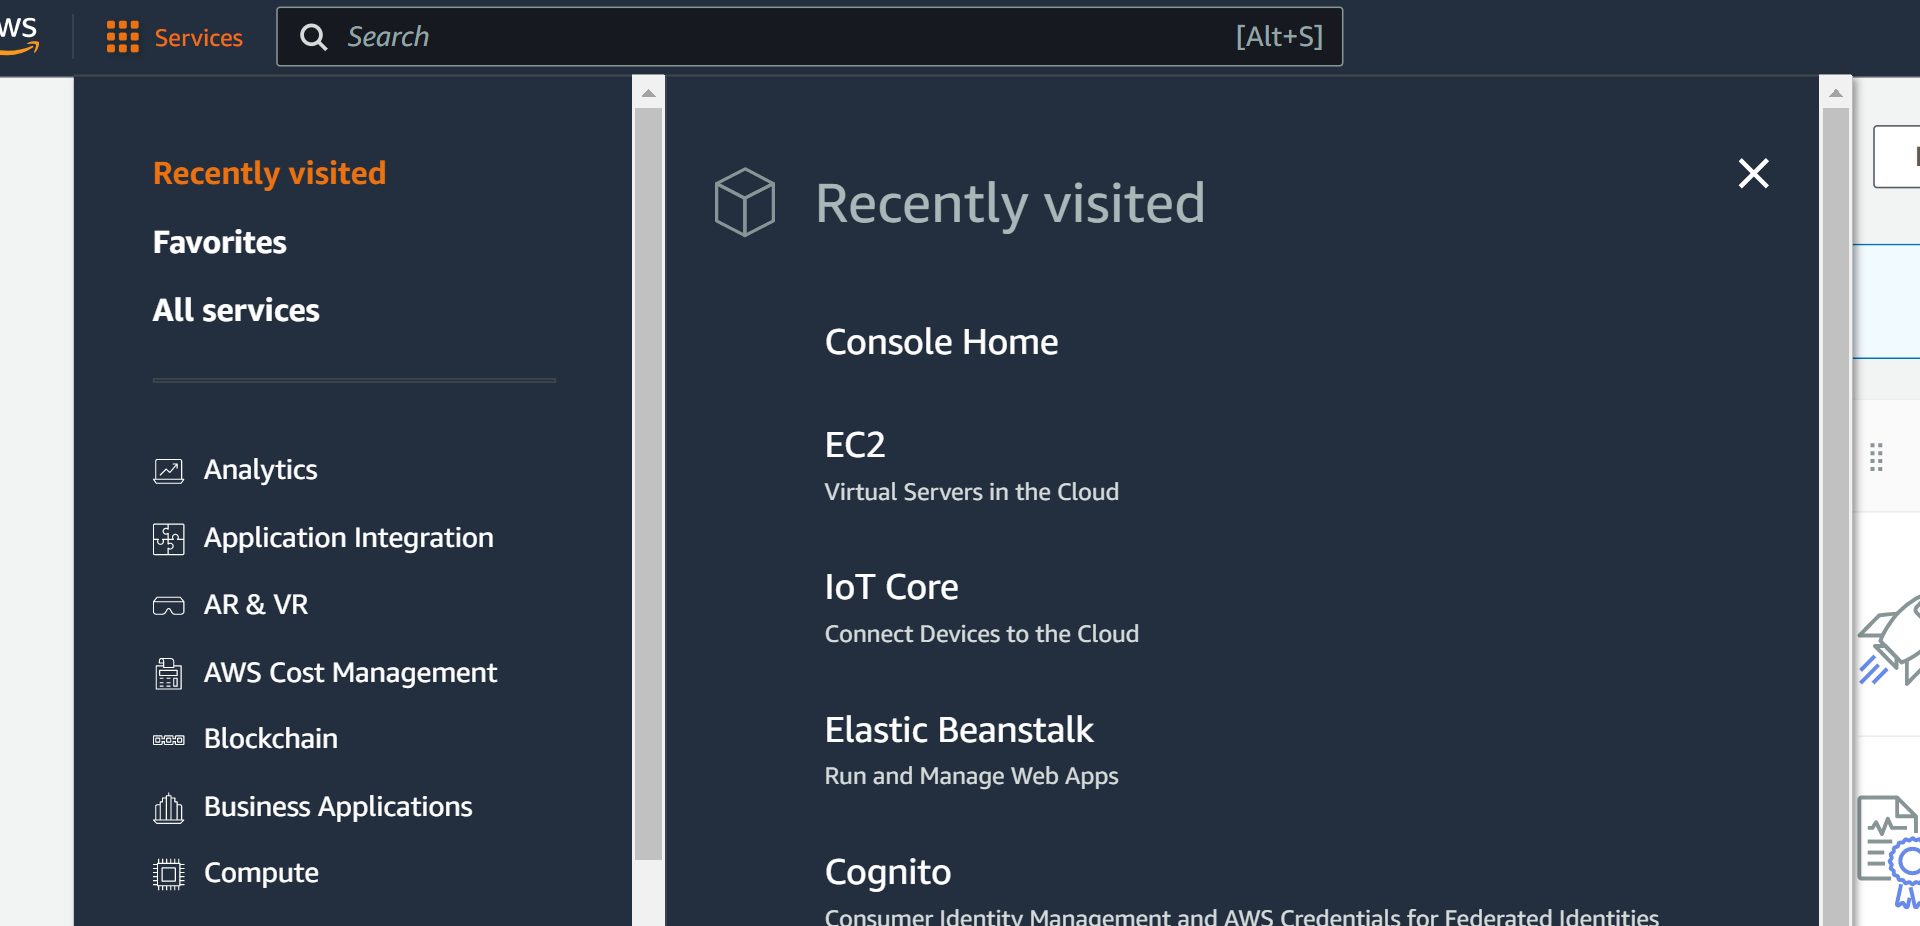
Login to your AWS account, at the left top corner click on services.
Then click on ec2 instance, this will launch the dashboard of EC2.
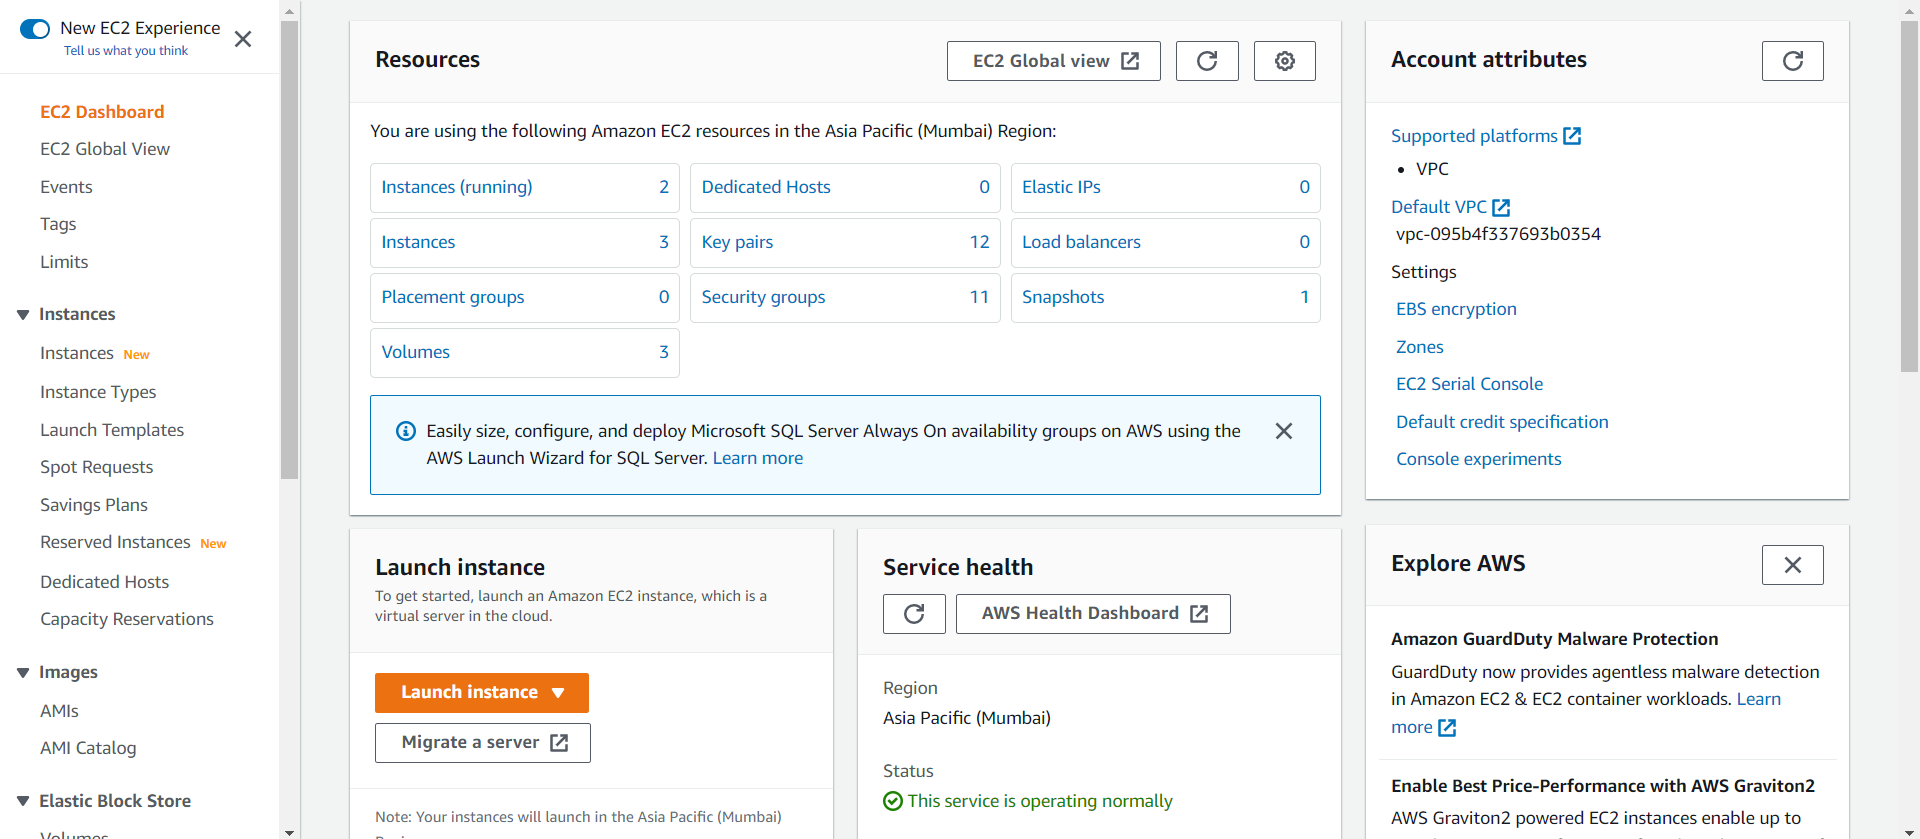
Here is the EC2 dashboard, you will get all the information about the AWS EC2 resource running.
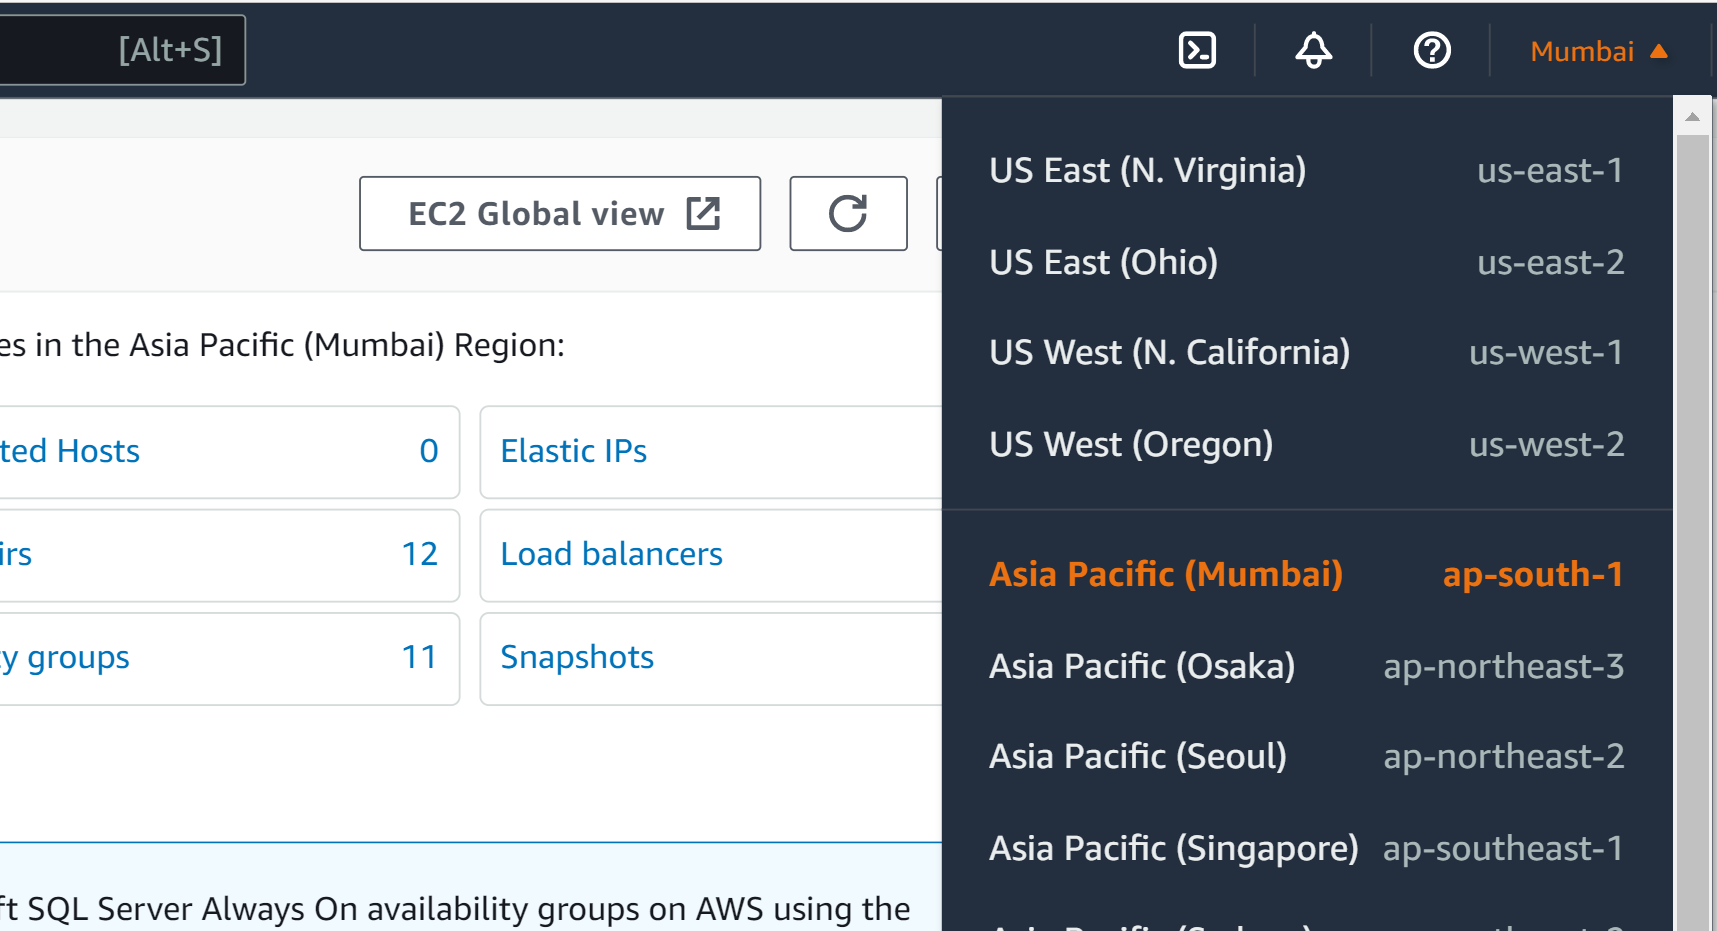
Step 2:
On the top right corner of the EC2 dashboard, choose the AWS region in which you want to deliver the EC2 server. Here we are selecting ap-south-1 region.
Step 3:
Once your desired region has been selected, come back to EC2 dashboard.
Click on ‘Launch Instance’ button in the top right corner of the dashboard.
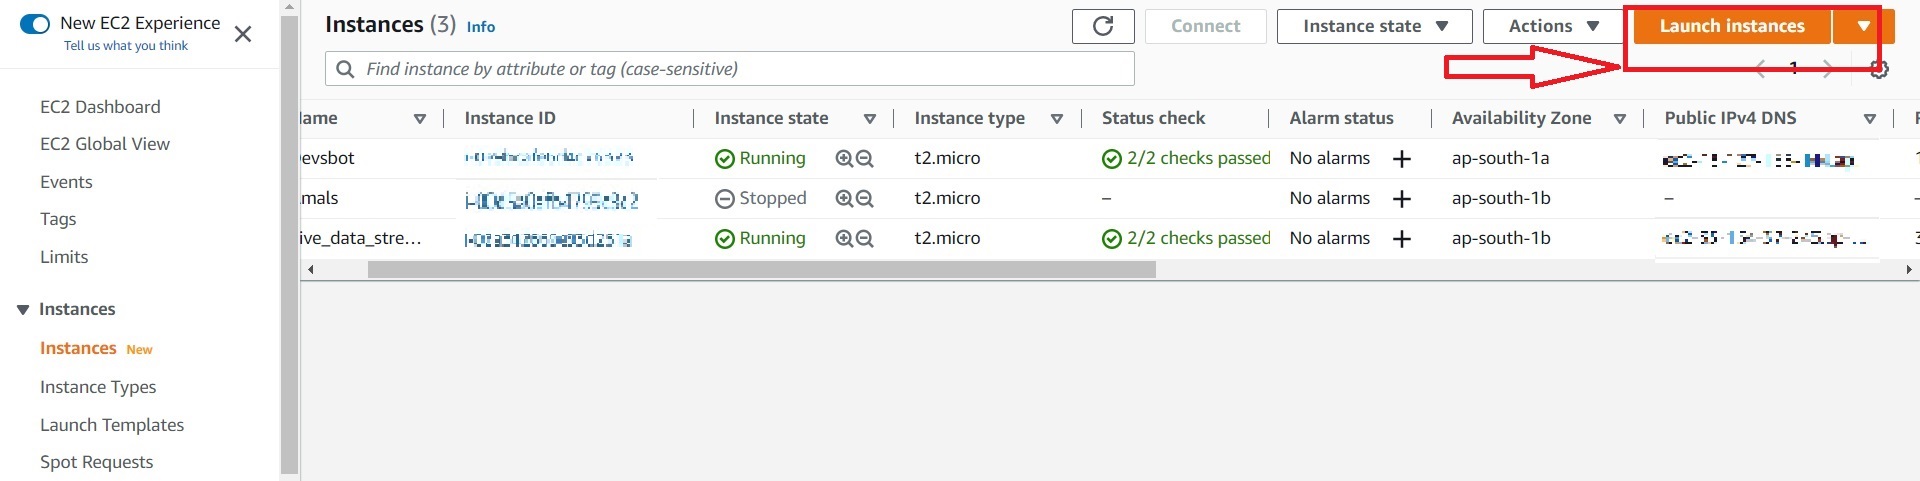
As soon as you click ‘Launch Instance’ your instance creation wizard page will get opened.
Step 4:
You can create your name and tag by clicking on additional tags
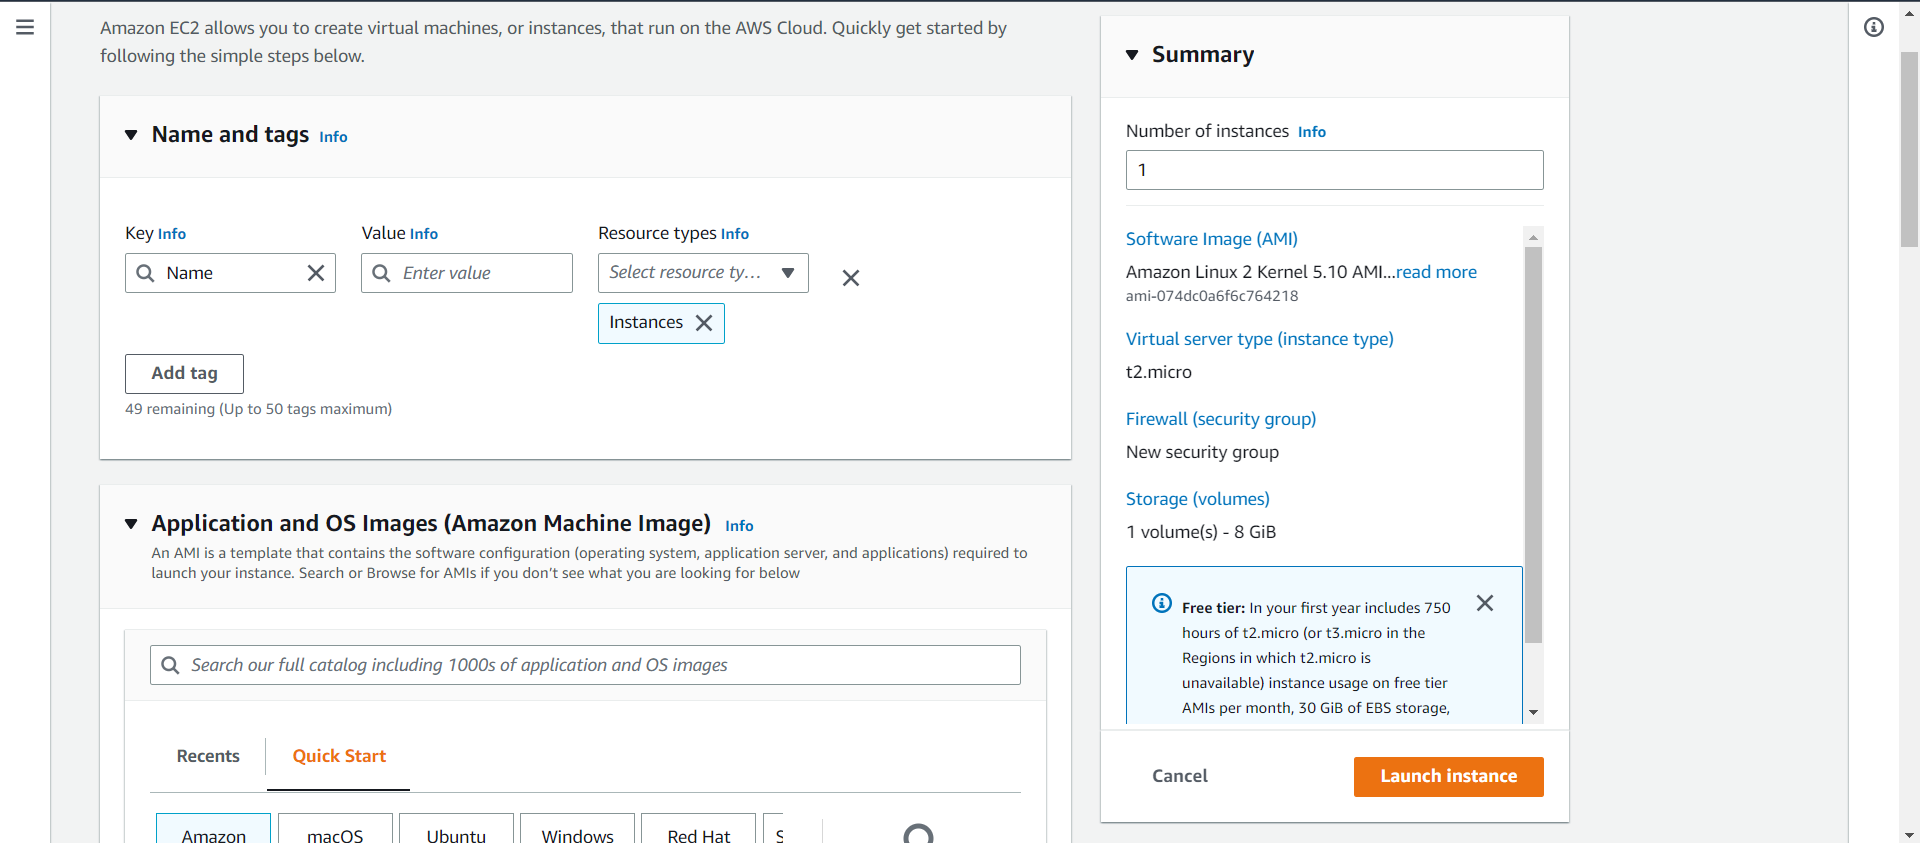
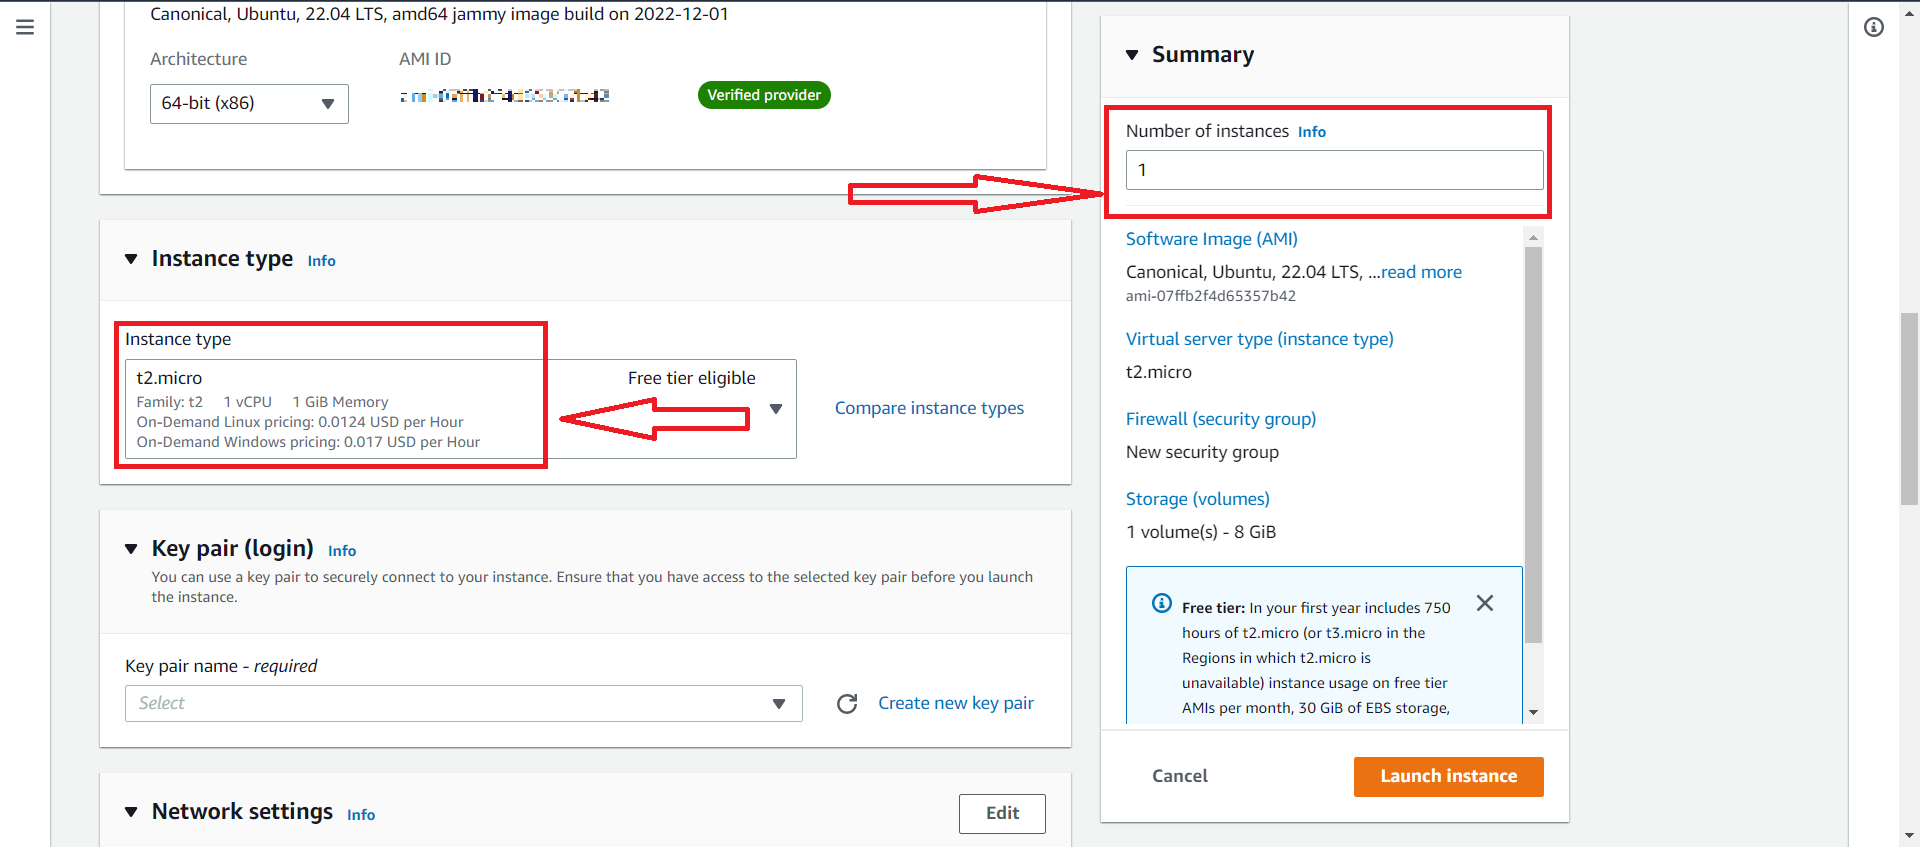
In application and OS images select ubuntu server 20.04 LTS(HVM) SSD volume type for installation of Mosquitto MQTT, Node-Red, Influx DB, and Grafana.
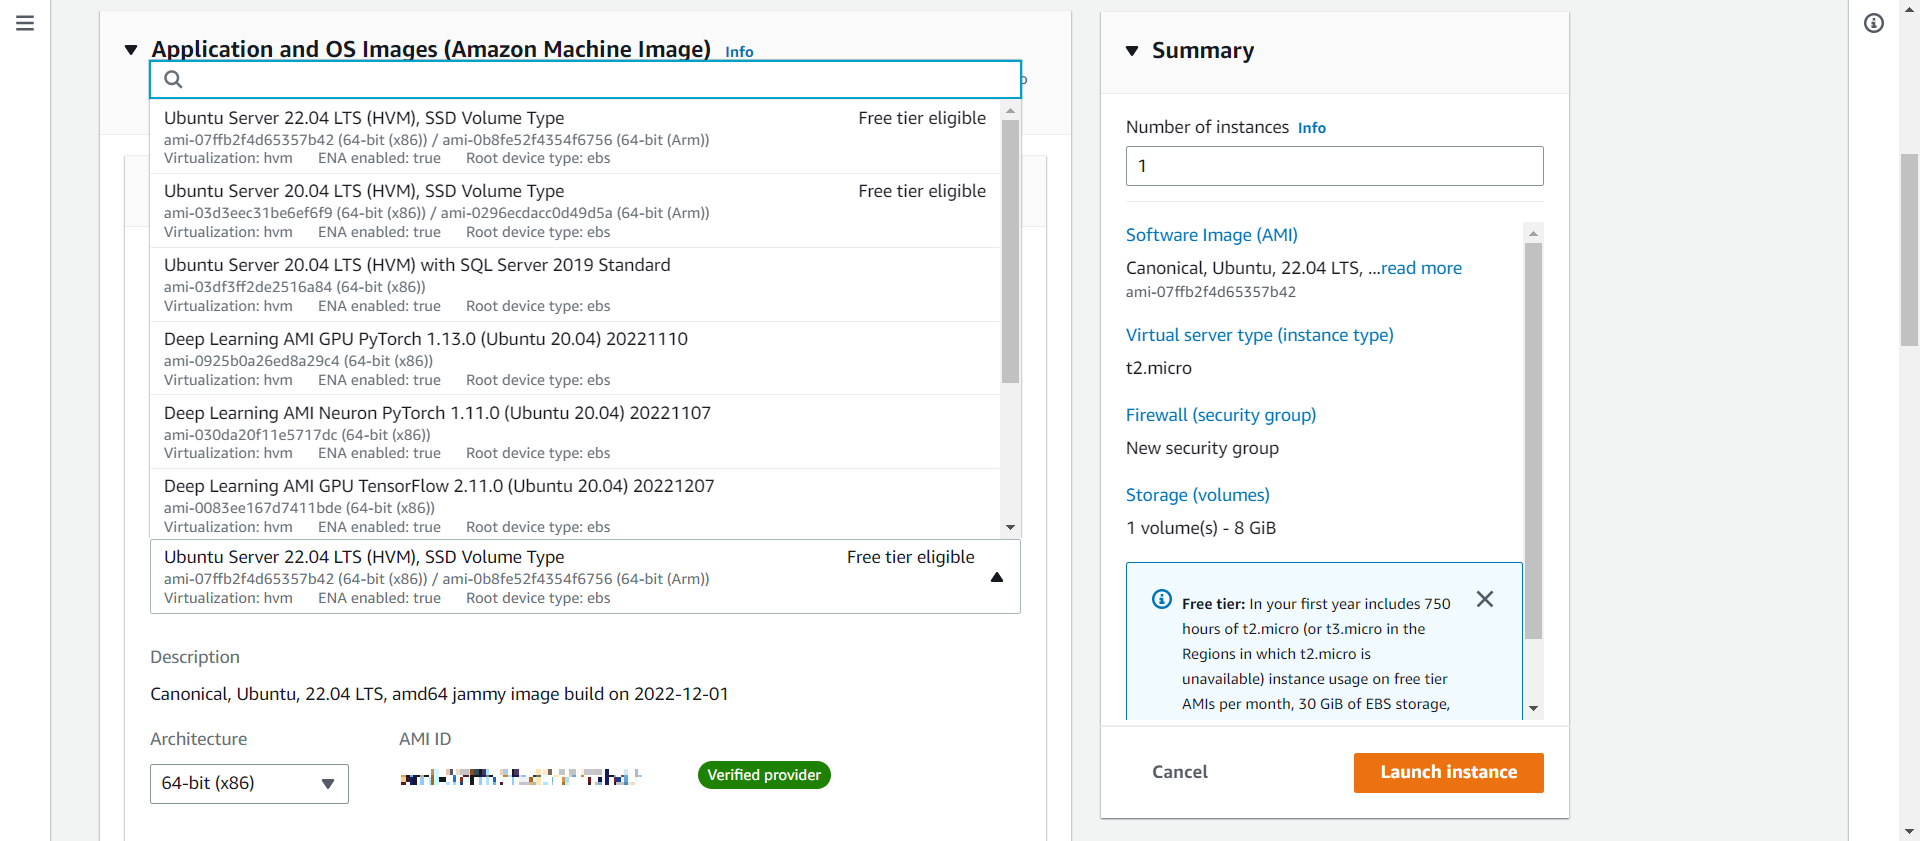
In instance type select t2. Micro, which is a 1VCPU and 1GB memory server offered by AWS. In the next step enter the number of instances you want to launch at a time, we are launching one instance.
In the next step you will be asked to create a key pair name to login to your instance. A key pair is a set of public-private keys. Once you are done with creating your key pair name click on create key pair.
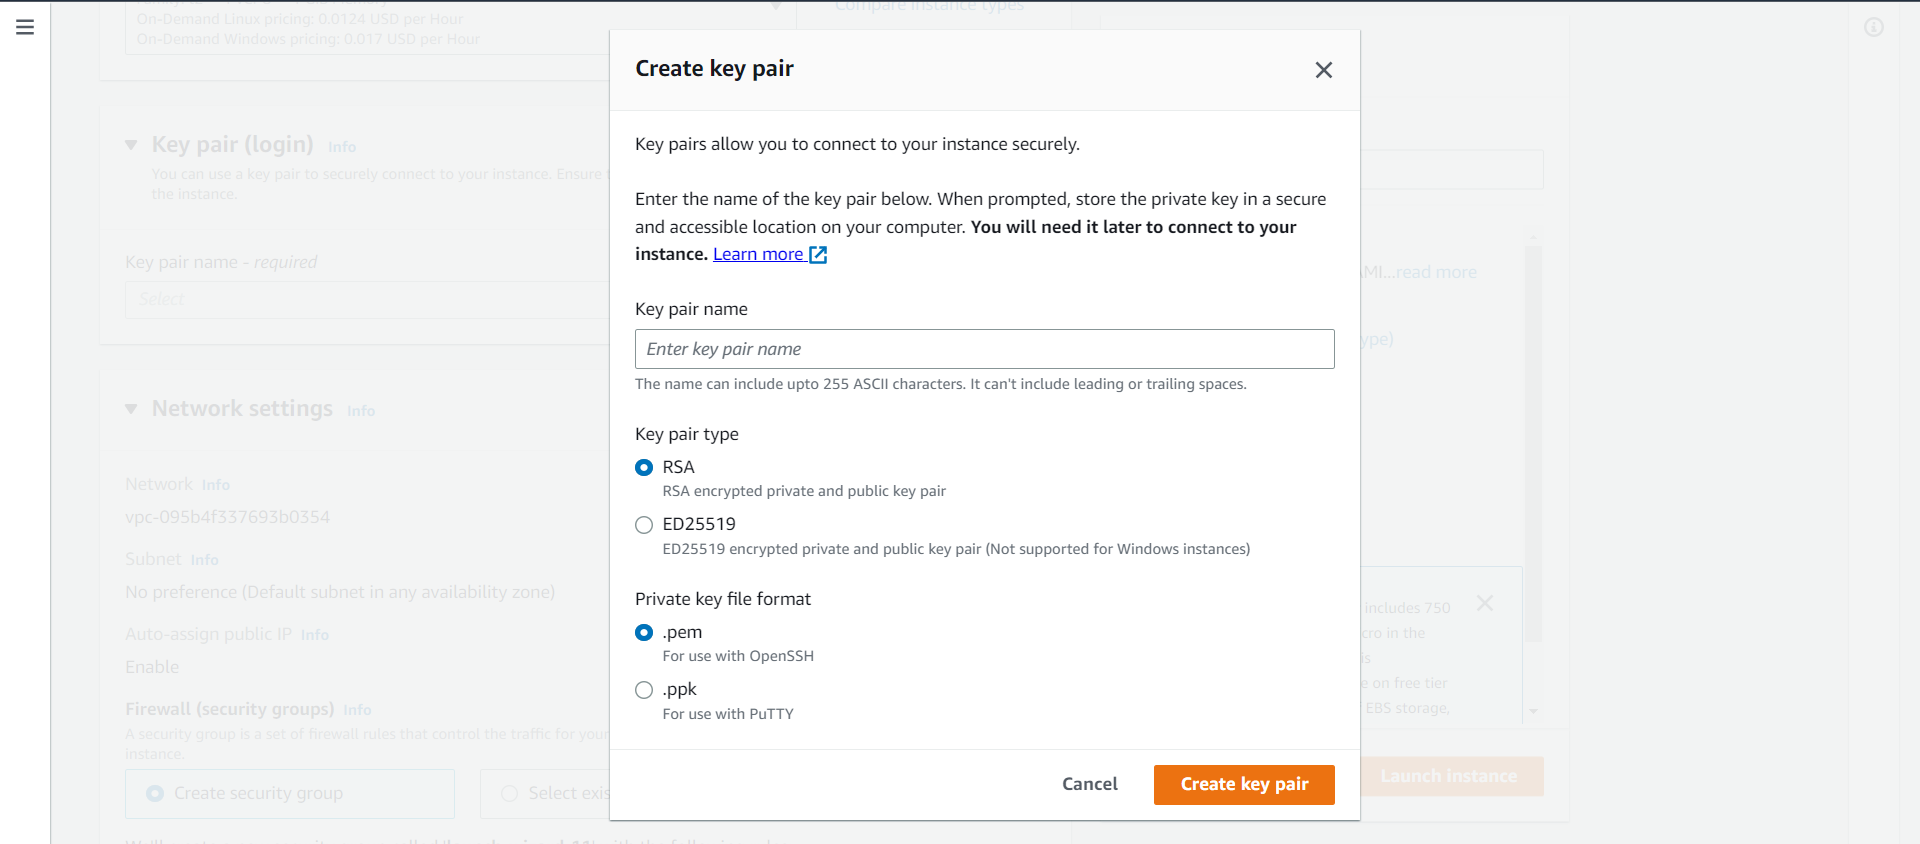
Your private key gets downloaded automatically. Make sure you download the key and keep it safe and secured in a separate folder, if it is lost you cannot download it again.
*Create a new key pair.
*Give a name to your key.
*Download and save it in your secured folder.
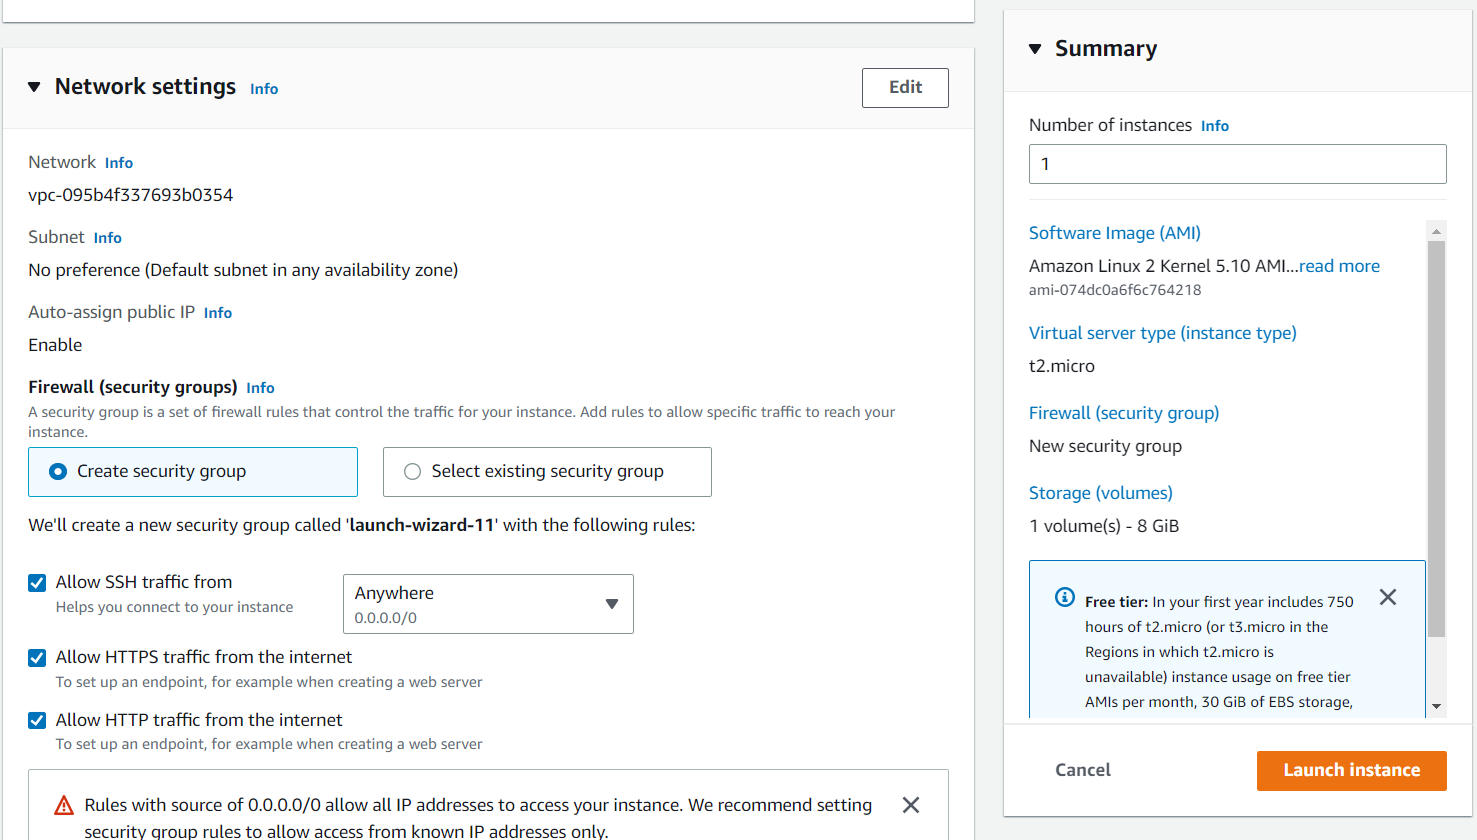
In the network settings allow access to SSH, HTTPS and HTTP and click on launch instance.
Installation of Mosquitto MQTT Ubuntu 20.04 server:
Mosquitto is an open-source message broker that uses the message queuing telemetry transport (MQTT) protocol.
Mosquitto is lightweight and is suitable for use on all devices from low power single board computer to full servers.
PREREQUISITES:
- An ubuntu 20.04 server.
- A non-root user with sudo rights.
Now go back to EC2 instance and click on instance ID.
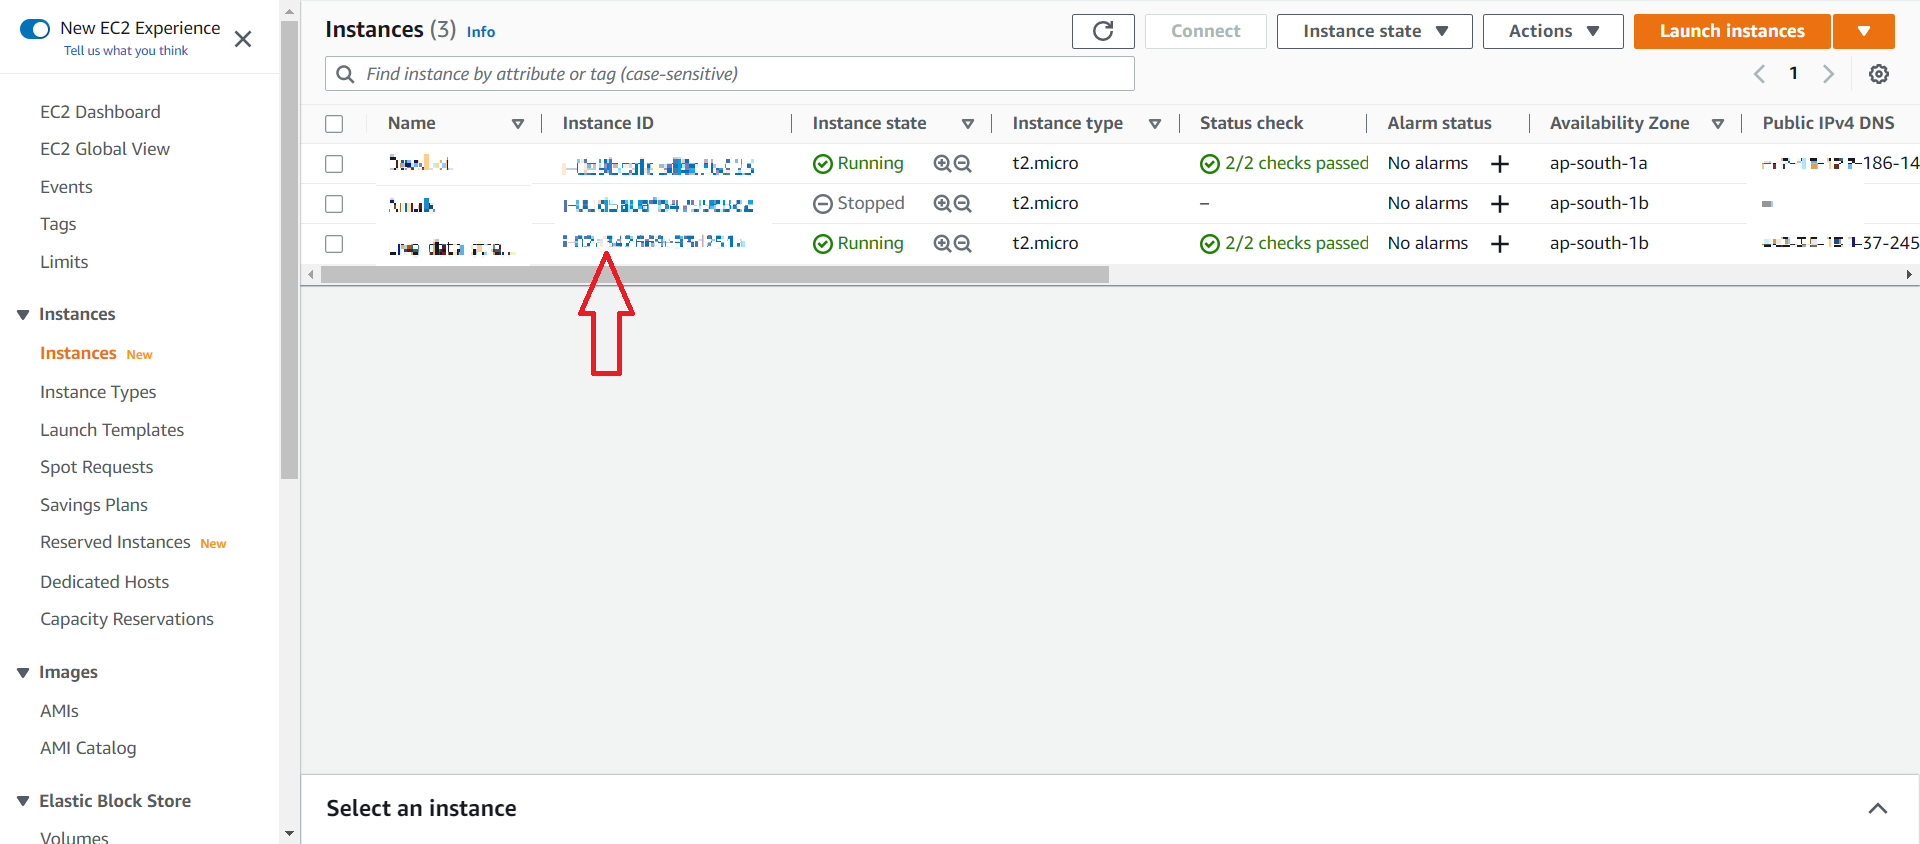
Copy the public IPV4 address. Now open putty and paste your public IPv4 address, since we are using ubuntu for installation type ubuntu@ your public IPv4 address
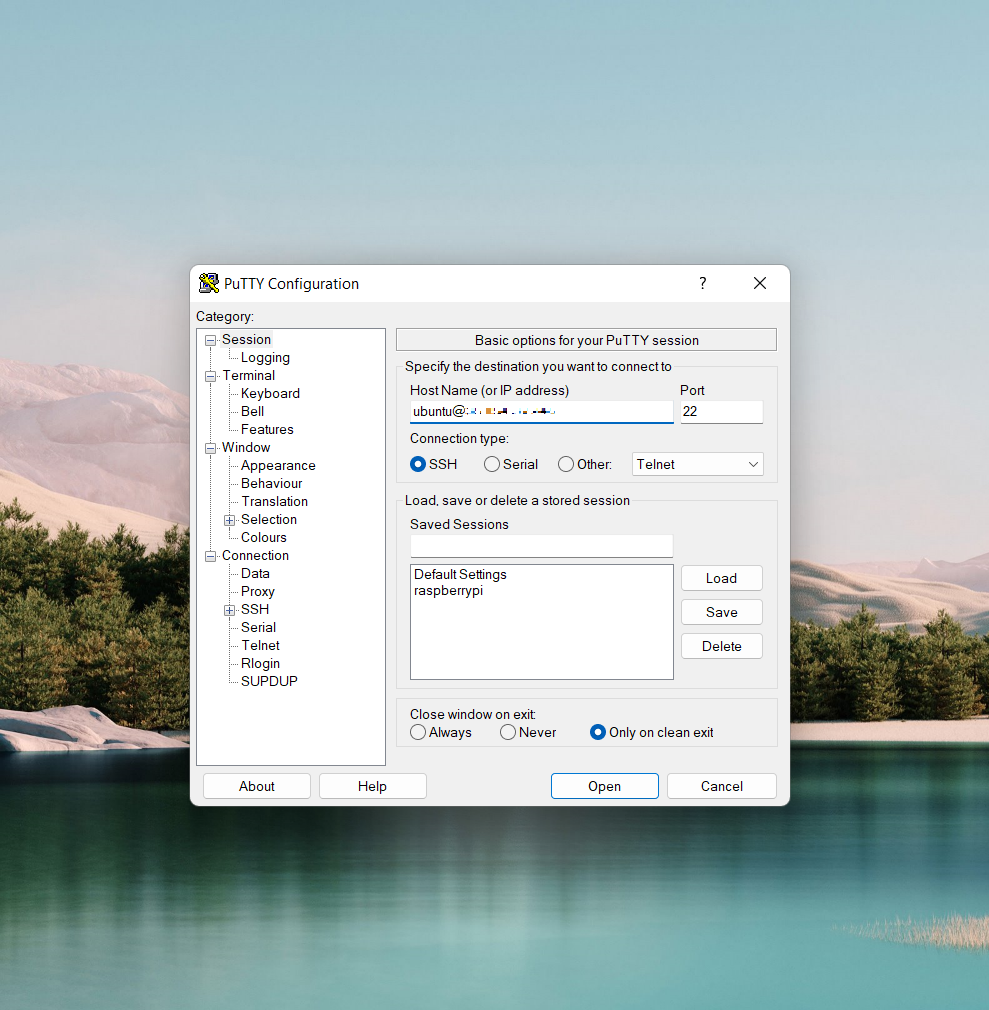
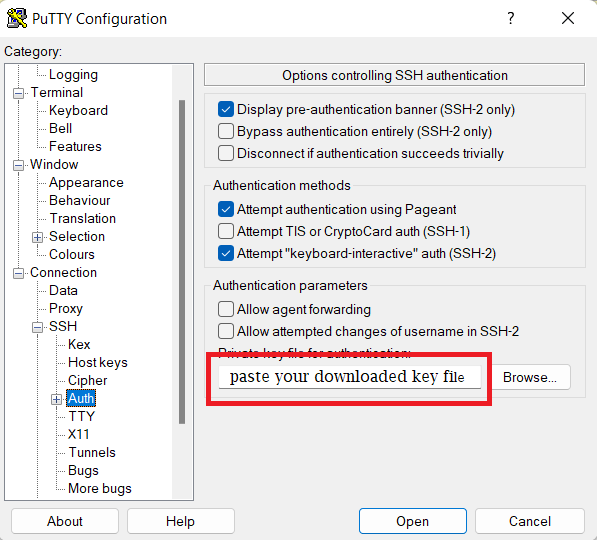
Now click on SSH which is on the left side under category click on Auth. Click on browse and paste your key file which you have downloaded while creating your key pair name and click open.
$ sudo apt update$ sudo apt install -y mosquitto$ sudo apt install -y mosquitto-clients$ sudo systemctl status mosquitto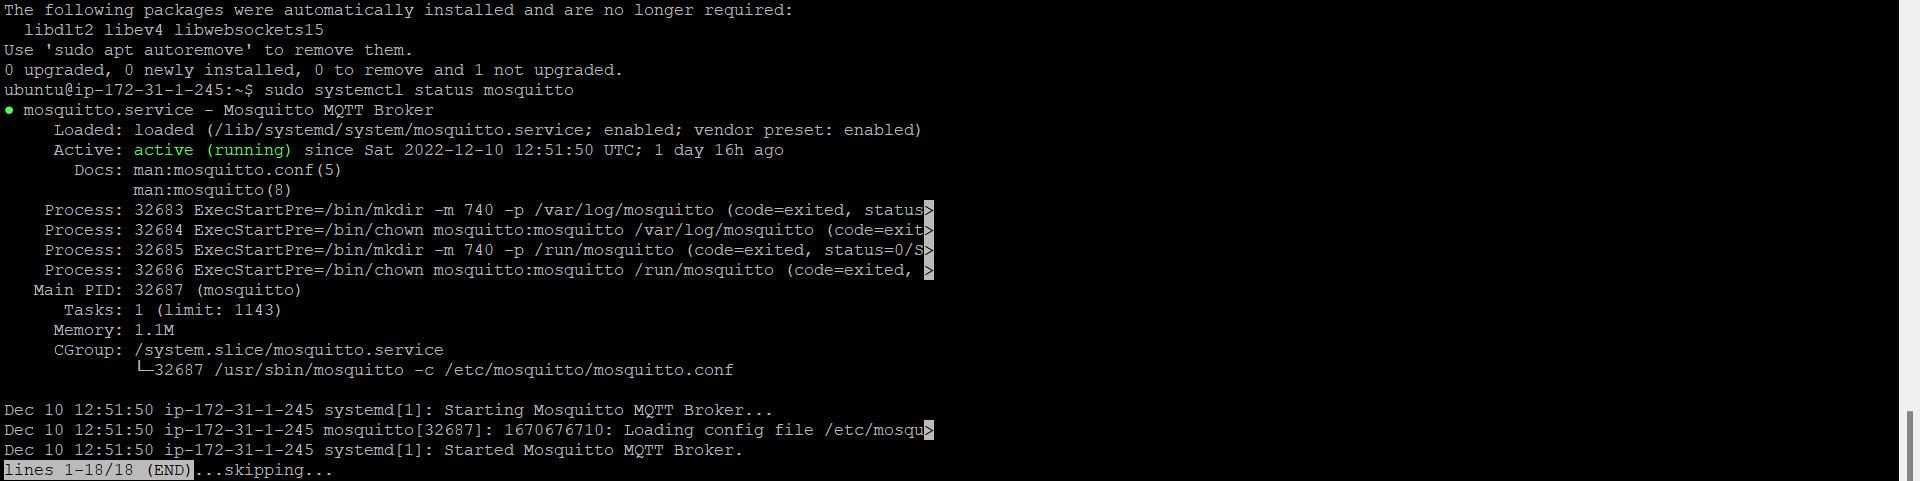
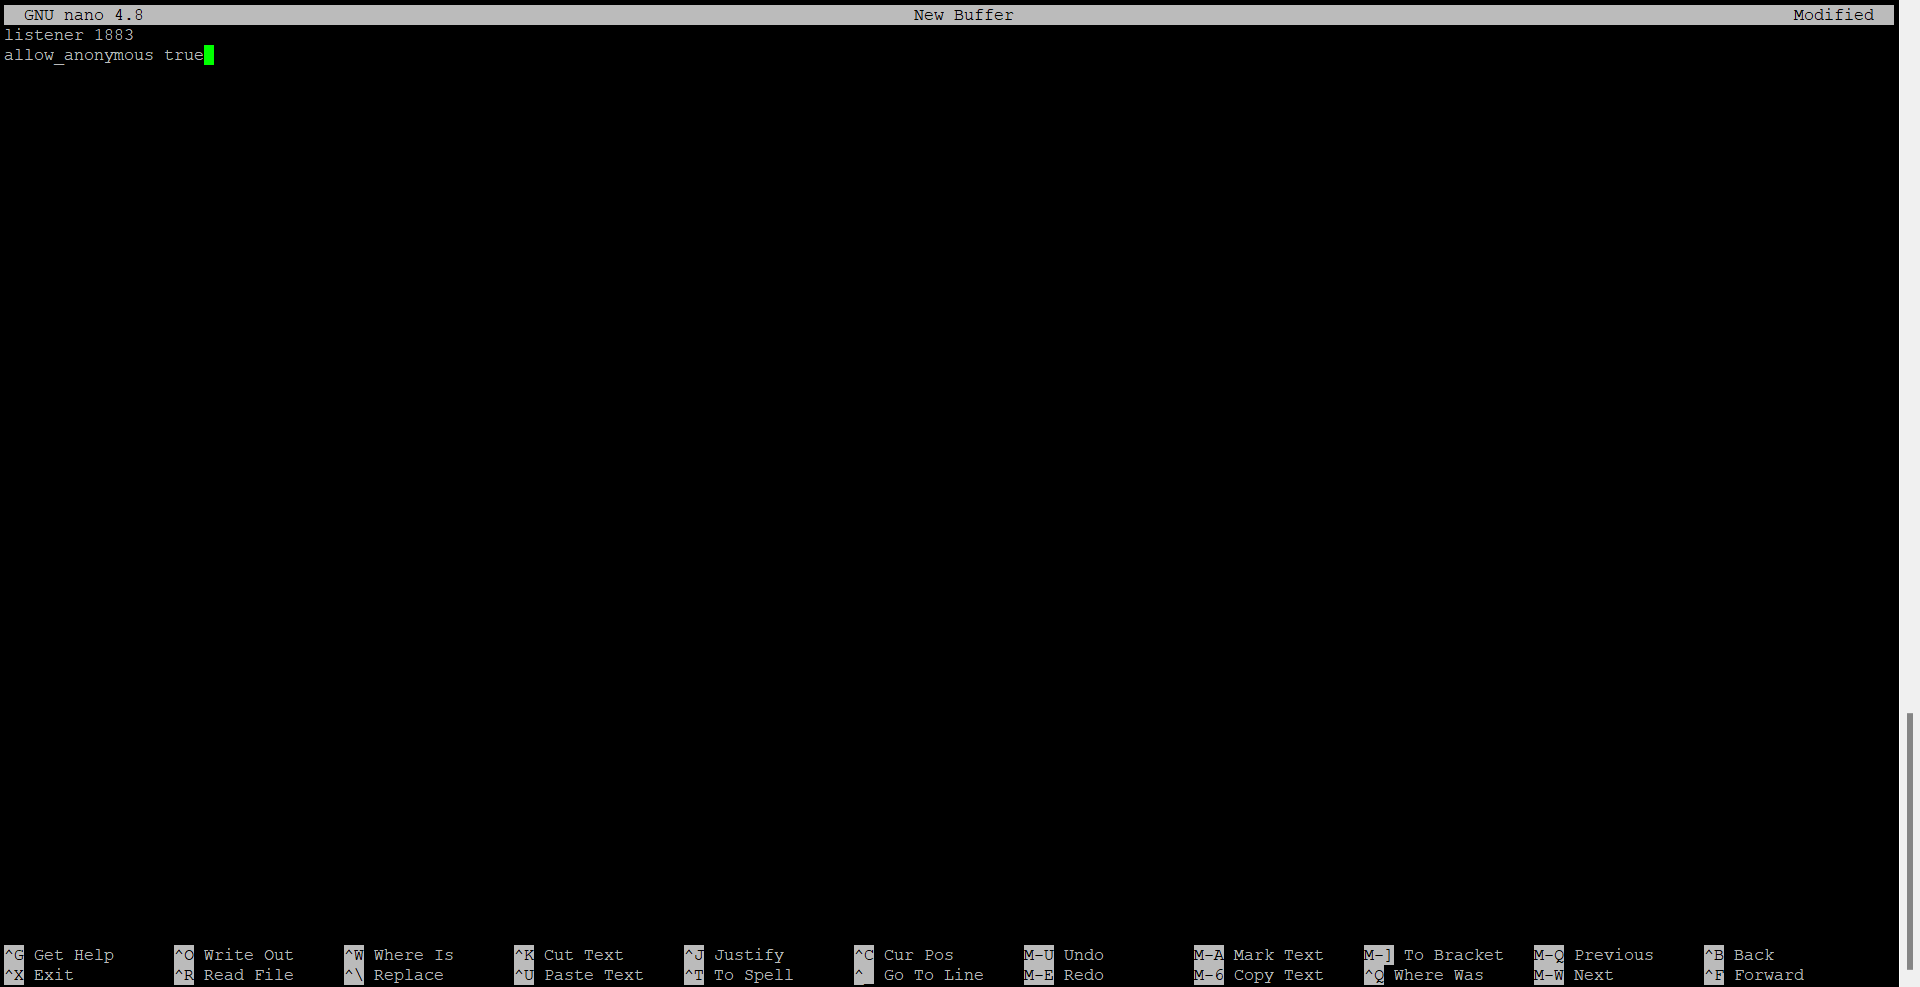
$ sudo nano /etc/mosquitto/conf.dlistener 1883
allow_anonymous true
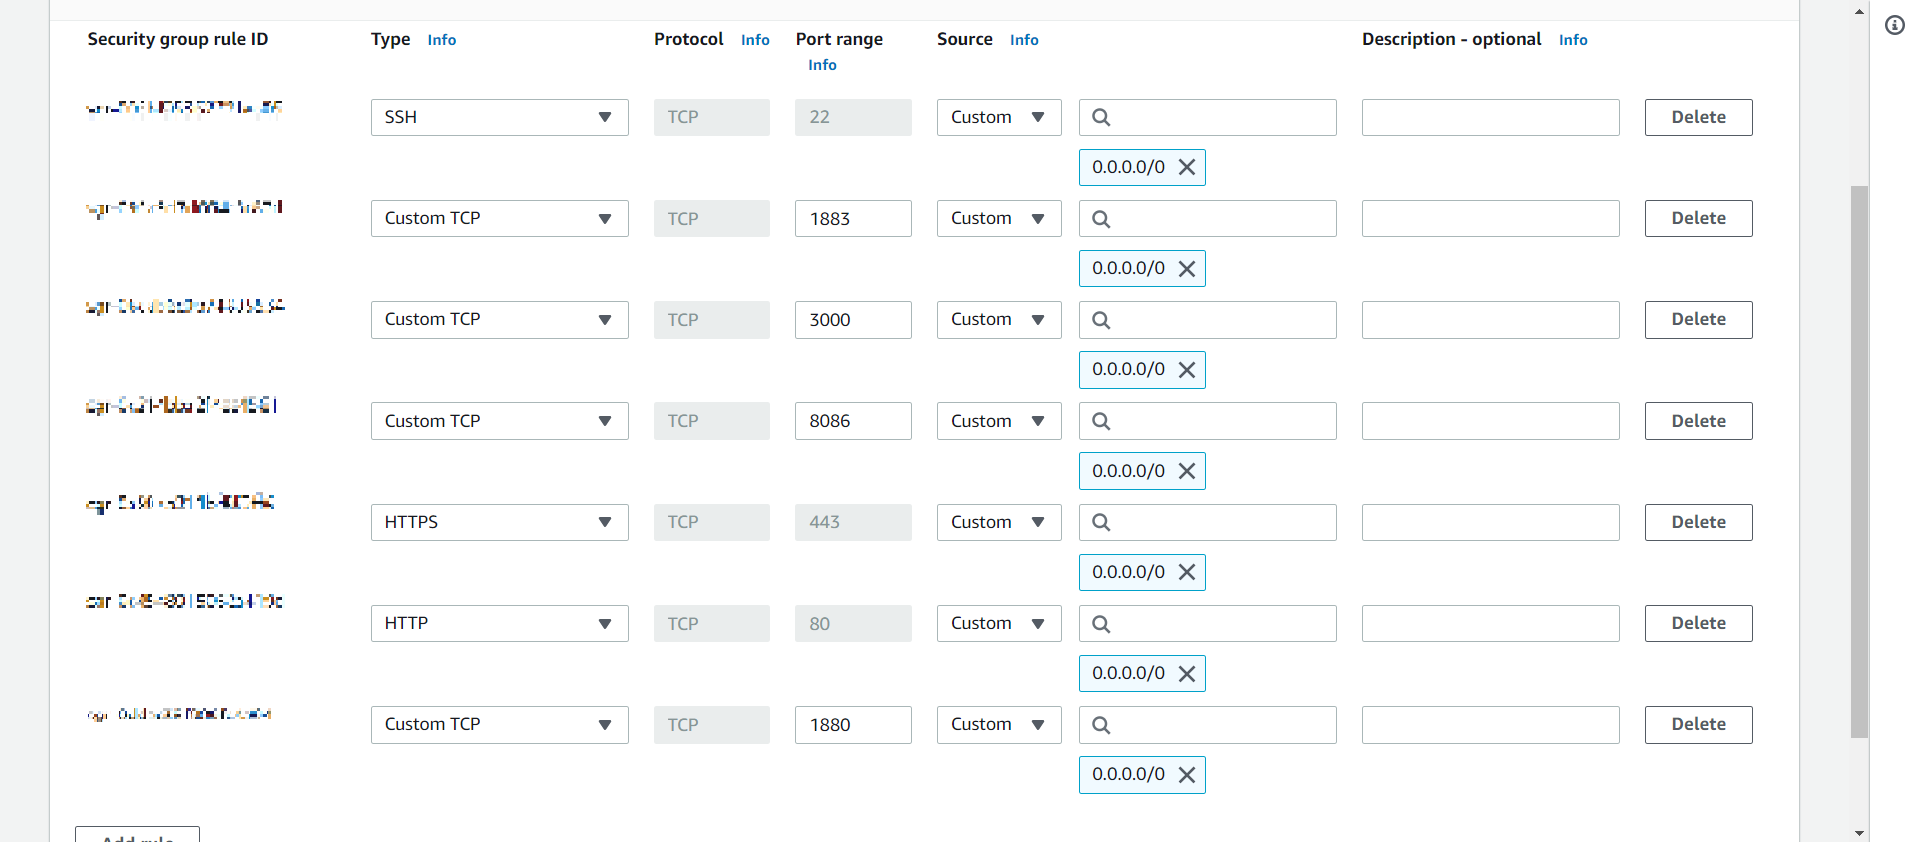
Now go back to EC2 dashboard and click on instance ID ->security->security groups->edit inbound rules and attach the Mosquitto port 1883.
We will configure other ports later.
Installation of Node-RED on Ubuntu 20.04:
curl -sL https://deb.nodesource.com/setup_12.x | sudo -E bash -
sudo apt-get install -y nodejs build-essential
sudo npm install -g --unsafe-perm node-red
Now go back to EC2 dashboard and add port 1880 in security follow the same steps as we did for Mosquitto MQTT.
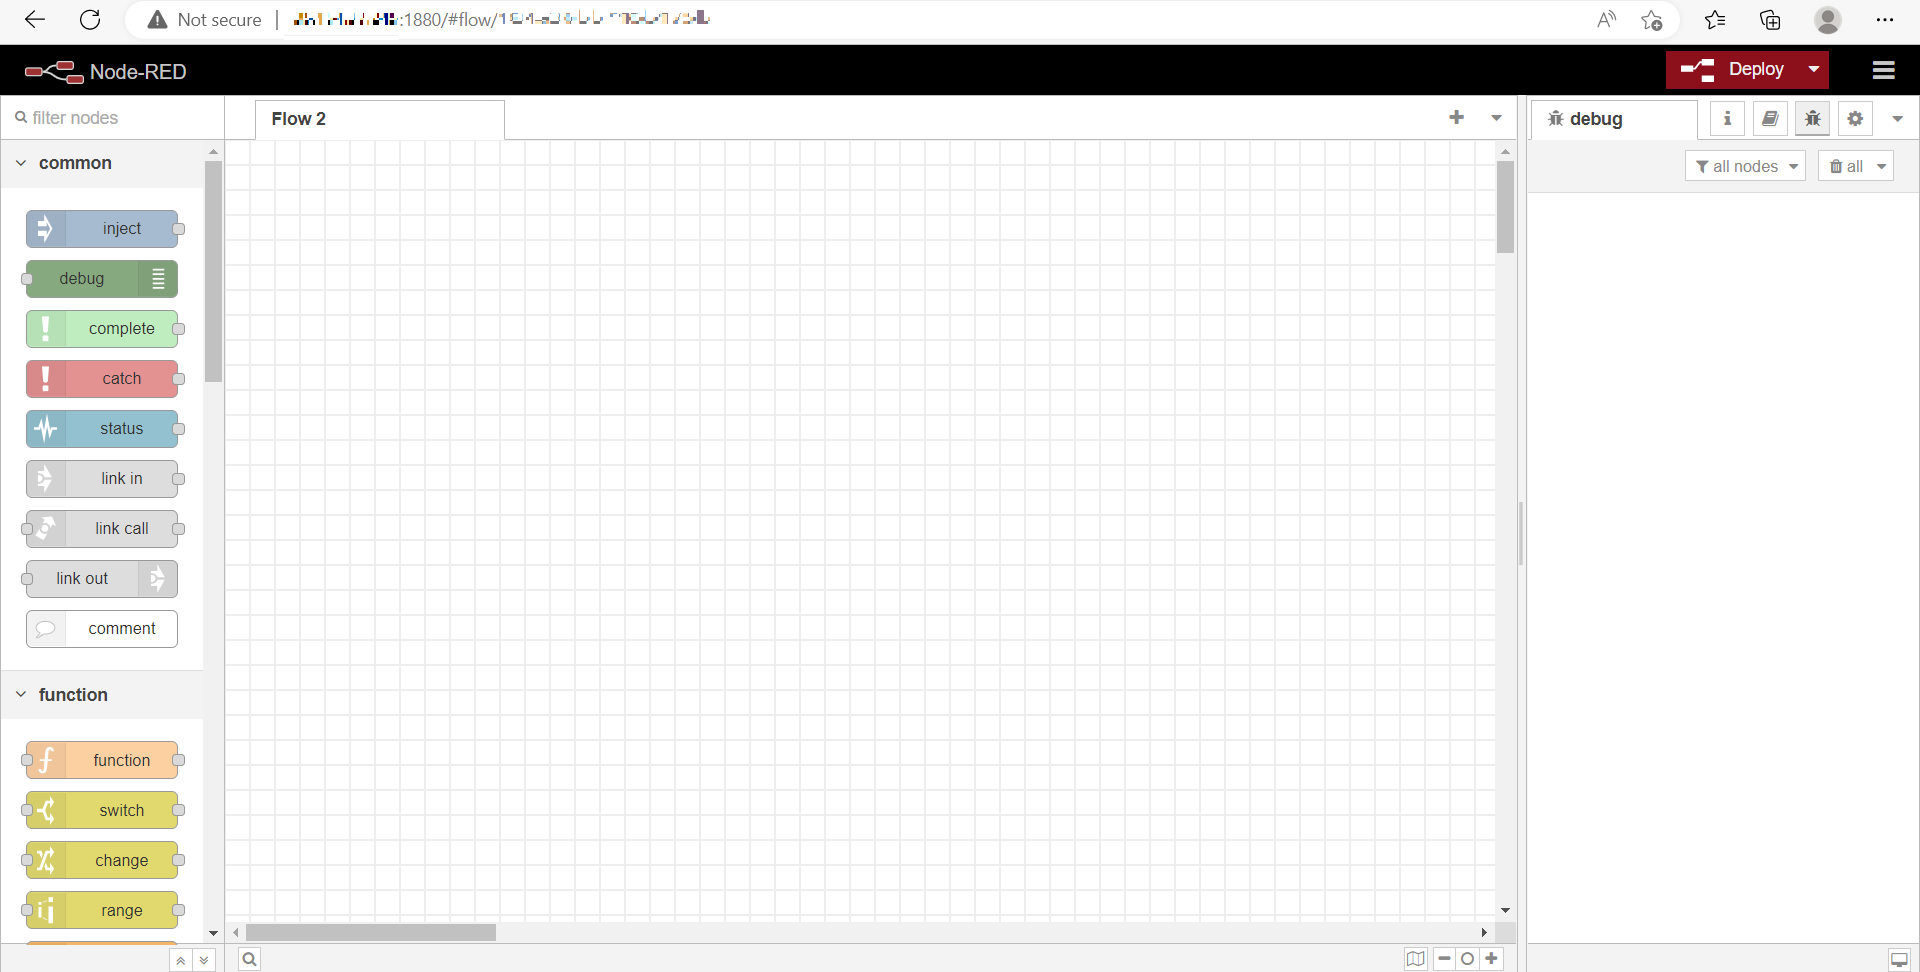
Once installed you can use the Node-Red command to start Node-Red in your terminal. To stop Node-Red you can use ctrl-c. You can then access the Node-Red editor by typing your <instance public IP address>:1880 on the browser.
Installation of InfluxDB on Ubuntu 20.04:
1.In this step, you’ll install the Influx DB server by pulling the installation files from the official repo maintained at Influxdata.com
sudo curl -sL https://repos.influxdata.com/influxdb.key | sudo apt-key add -
sudo echo "deb https://repos.influxdata.com/ubuntu bionic stable" | sudo tee /etc/apt/sources.list.d/influxdb.list
$ sudo apt update
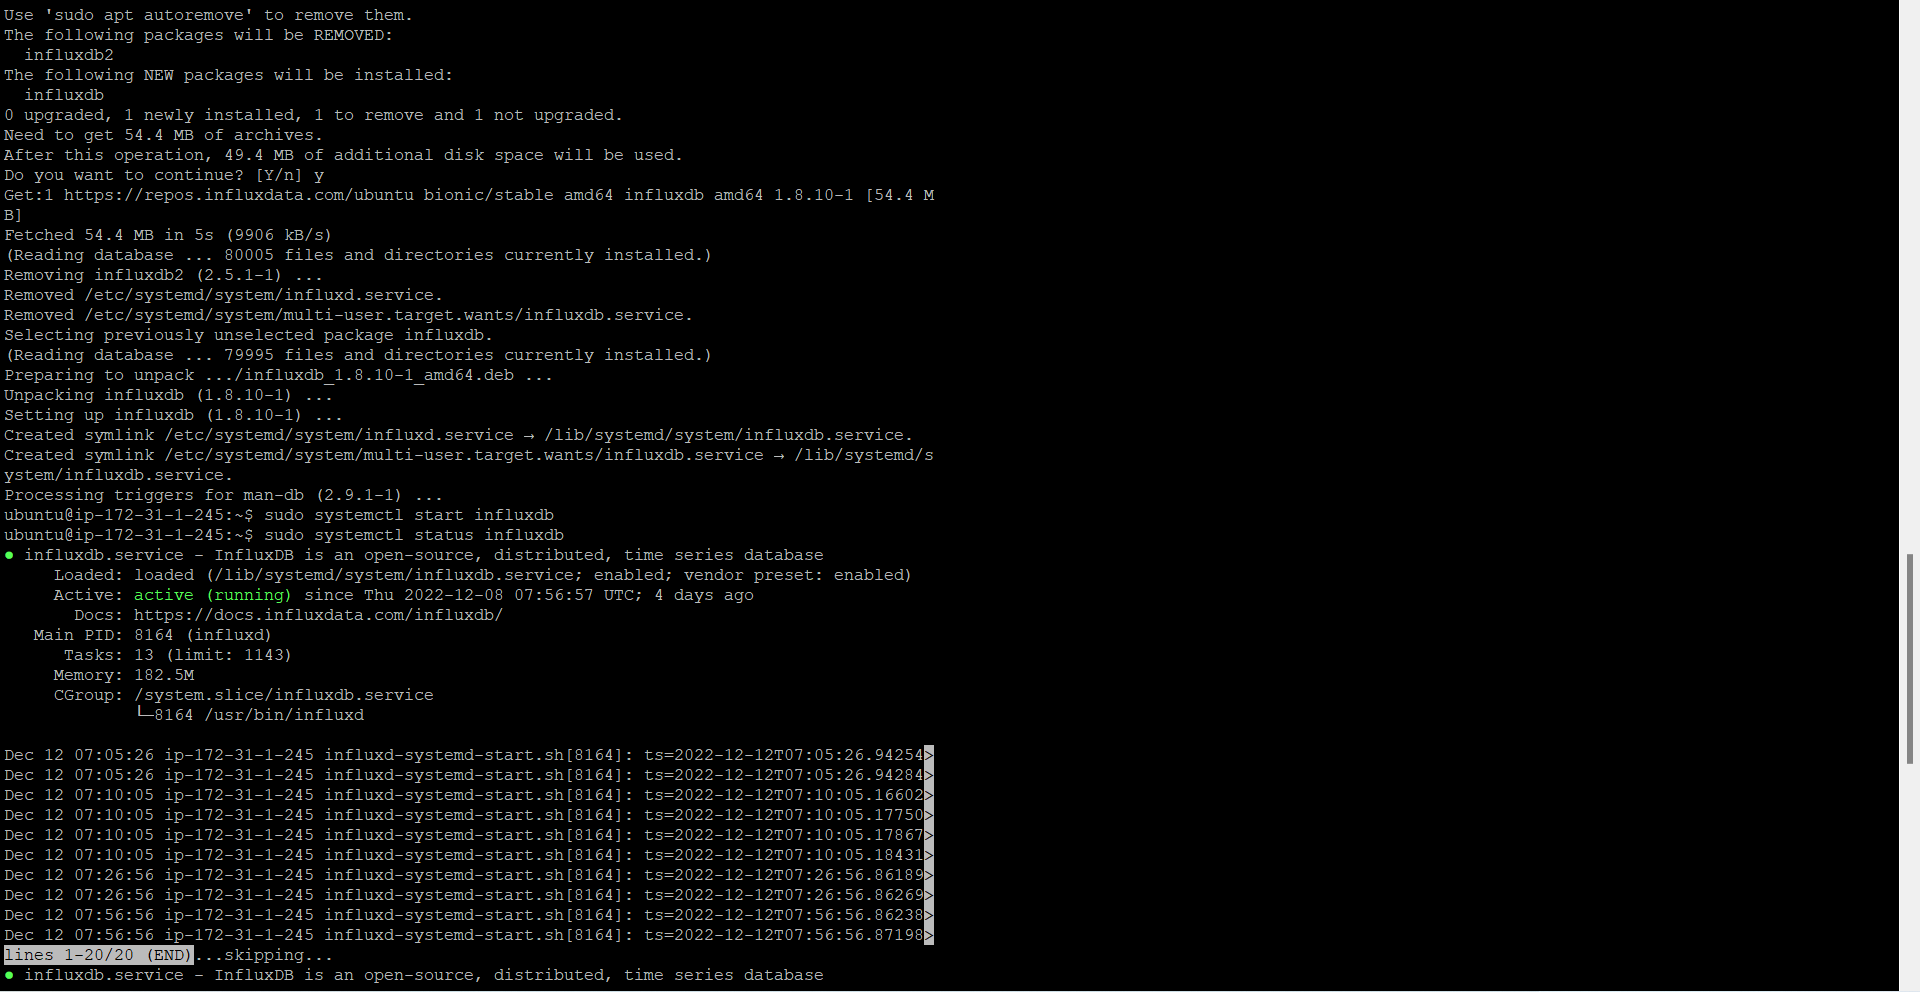
sudo apt install influxdb
sudo systemctl start influxdb
sudo systemctl status influxdb
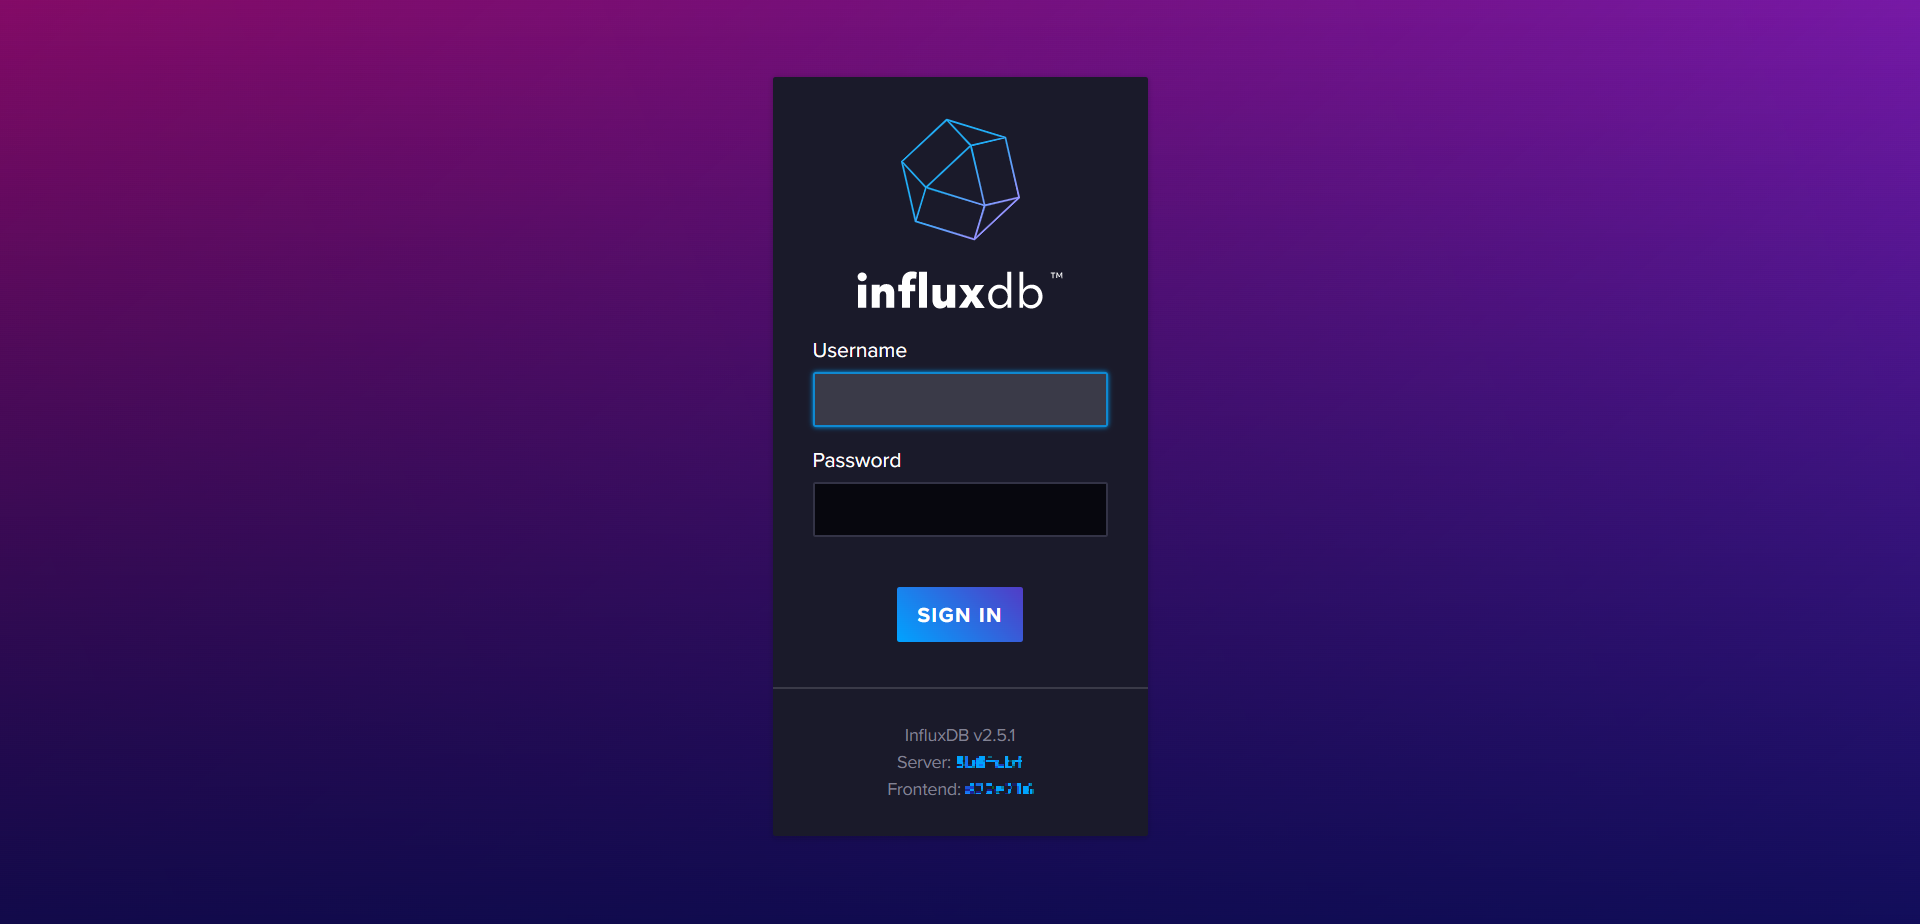
Now go back to EC2 dashboard and add port 8086 in security. You can then access InfluxDB editor by typing your <instance public IP address>:8086 on the browser.
Installation of Grafana on Ubuntu 20.04:
sudo apt-get update -y
sudo apt-get install wget curl gnupg2 apt-transport-https software-properties-common -y
wget -q -O - https://packages.grafana.com/gpg.key | sudo apt-key add -
echo "deb https://packages.grafana.com/oss/deb stable main" | sudo tee -a /etc/apt/sources.list.d/grafana.list
sudo apt-get update -
sudo apt-get install grafana -y
grafana-server -v
sudo systemctl start grafana-server
Publishing sensor data from DHT11 via MQTT with ESP32 to Node-RED, InfluxDB and Grafana:
#include "DHT.h"
#include
extern "C" {
  #include "freertos/FreeRTOS.h"
  #include "freertos/timers.h"
}
#include

#define WIFI_SSID "XXXXX"
#define WIFI_PASSWORD "XXXX"

// Raspberry Pi Mosquitto MQTT Broker
#define MQTT_HOST IPAddress(XXXXXXXXX)
// For a cloud MQTT broker, type the domain name
//#define MQTT_HOST "example.com"
#define MQTT_PORT 1883

// Temperature MQTT Topics
#define MQTT_PUB_TEMP "esp32/dht/temperature"
#define MQTT_PUB_HUM  "esp32/dht/humidity"

// Digital pin connected to the DHT sensor
#define DHTPIN 4

// Uncomment whatever DHT sensor type you're using
#define DHTTYPE DHT11   // DHT 11
//#define DHTTYPE DHT22   // DHT 22  (AM2302), AM2321
//#define DHTTYPE DHT21   // DHT 21 (AM2301)

// Initialize DHT sensor
DHT dht(DHTPIN, DHTTYPE);

// Variables to hold sensor readings
float temp;
float hum;

AsyncMqttClient mqttClient;
TimerHandle_t mqttReconnectTimer;
TimerHandle_t wifiReconnectTimer;

unsigned long previousMillis = 0;   // Stores last time temperature was published
const long interval = 10000;        // Interval at which to publish sensor readings

void connectToWifi() {
  Serial.println("Connecting to Wi-Fi...");
  WiFi.begin(WIFI_SSID, WIFI_PASSWORD);
}

void connectToMqtt() {
  Serial.println("Connecting to MQTT...");
  mqttClient.connect();
}

void WiFiEvent(WiFiEvent_t event) {
  Serial.printf("[WiFi-event] event: %d\n", event);
  switch(event) {
    case SYSTEM_EVENT_STA_GOT_IP:
      Serial.println("WiFi connected");
      Serial.println("IP address: ");
      Serial.println(WiFi.localIP());
      connectToMqtt();
      break;
    case SYSTEM_EVENT_STA_DISCONNECTED:
      Serial.println("WiFi lost connection");
      xTimerStop(mqttReconnectTimer, 0); // ensure we don't reconnect to MQTT while reconnecting to Wi-Fi
      xTimerStart(wifiReconnectTimer, 0);
      break;
  }
}

void onMqttConnect(bool sessionPresent) {
  Serial.println("Connected to MQTT.");
  Serial.print("Session present: ");
  Serial.println(sessionPresent);
}

void onMqttDisconnect(AsyncMqttClientDisconnectReason reason) {
  Serial.println("Disconnected from MQTT.");
  if (WiFi.isConnected()) {
    xTimerStart(mqttReconnectTimer, 0);
  }
}

/*void onMqttSubscribe(uint16_t packetId, uint8_t qos) {
  Serial.println("Subscribe acknowledged.");
  Serial.print("  packetId: ");
  Serial.println(packetId);
  Serial.print("  qos: ");
  Serial.println(qos);
}
void onMqttUnsubscribe(uint16_t packetId) {
  Serial.println("Unsubscribe acknowledged.");
  Serial.print("  packetId: ");
  Serial.println(packetId);
}*/

void onMqttPublish(uint16_t packetId) {
  Serial.print("Publish acknowledged.");
  Serial.print("  packetId: ");
  Serial.println(packetId);
}

void setup() {
  Serial.begin(115200);
  Serial.println();

  dht.begin();

  mqttReconnectTimer = xTimerCreate("mqttTimer", pdMS_TO_TICKS(2000), pdFALSE, (void*)0, reinterpret_cast(connectToMqtt));
  wifiReconnectTimer = xTimerCreate("wifiTimer", pdMS_TO_TICKS(2000), pdFALSE, (void*)0, reinterpret_cast(connectToWifi));

  WiFi.onEvent(WiFiEvent);

  mqttClient.onConnect(onMqttConnect);
  mqttClient.onDisconnect(onMqttDisconnect);
  //mqttClient.onSubscribe(onMqttSubscribe);
  //mqttClient.onUnsubscribe(onMqttUnsubscribe);
  mqttClient.onPublish(onMqttPublish);
  mqttClient.setServer(MQTT_HOST, MQTT_PORT);
  // If your broker requires authentication (username and password), set them below
  //mqttClient.setCredentials("REPlACE_WITH_YOUR_USER", "REPLACE_WITH_YOUR_PASSWORD");
  connectToWifi();
}

void loop() {
  unsigned long currentMillis = millis();
  // Every X number of seconds (interval = 10 seconds)
  // it publishes a new MQTT message
  if (currentMillis - previousMillis >= interval) {
    // Save the last time a new reading was published
    previousMillis = currentMillis;
    // New DHT sensor readings
    hum = dht.readHumidity();
    // Read temperature as Celsius (the default)
    temp = dht.readTemperature();
    // Read temperature as Fahrenheit (isFahrenheit = true)
    //temp = dht.readTemperature(true);

    // Check if any reads failed and exit early (to try again).
    if (isnan(temp) || isnan(hum)) {
      Serial.println(F("Failed to read from DHT sensor!"));
      return;
    }

    // Publish an MQTT message on topic esp32/dht/temperature
    uint16_t packetIdPub1 = mqttClient.publish(MQTT_PUB_TEMP, 1, true, String(temp).c_str());
    Serial.printf("Publishing on topic %s at QoS 1, packetId: %i", MQTT_PUB_TEMP, packetIdPub1);
    Serial.printf("Message: %.2f \n", temp);

    // Publish an MQTT message on topic esp32/dht/humidity
    uint16_t packetIdPub2 = mqttClient.publish(MQTT_PUB_HUM, 1, true, String(hum).c_str());
    Serial.printf("Publishing on topic %s at QoS 1, packetId %i: ", MQTT_PUB_HUM, packetIdPub2);
    Serial.printf("Message: %.2f \n", hum);
  }
}
Code source:https://randomnerdtutorials.com/esp32-mqtt-publish-dht11-dht22-arduino/
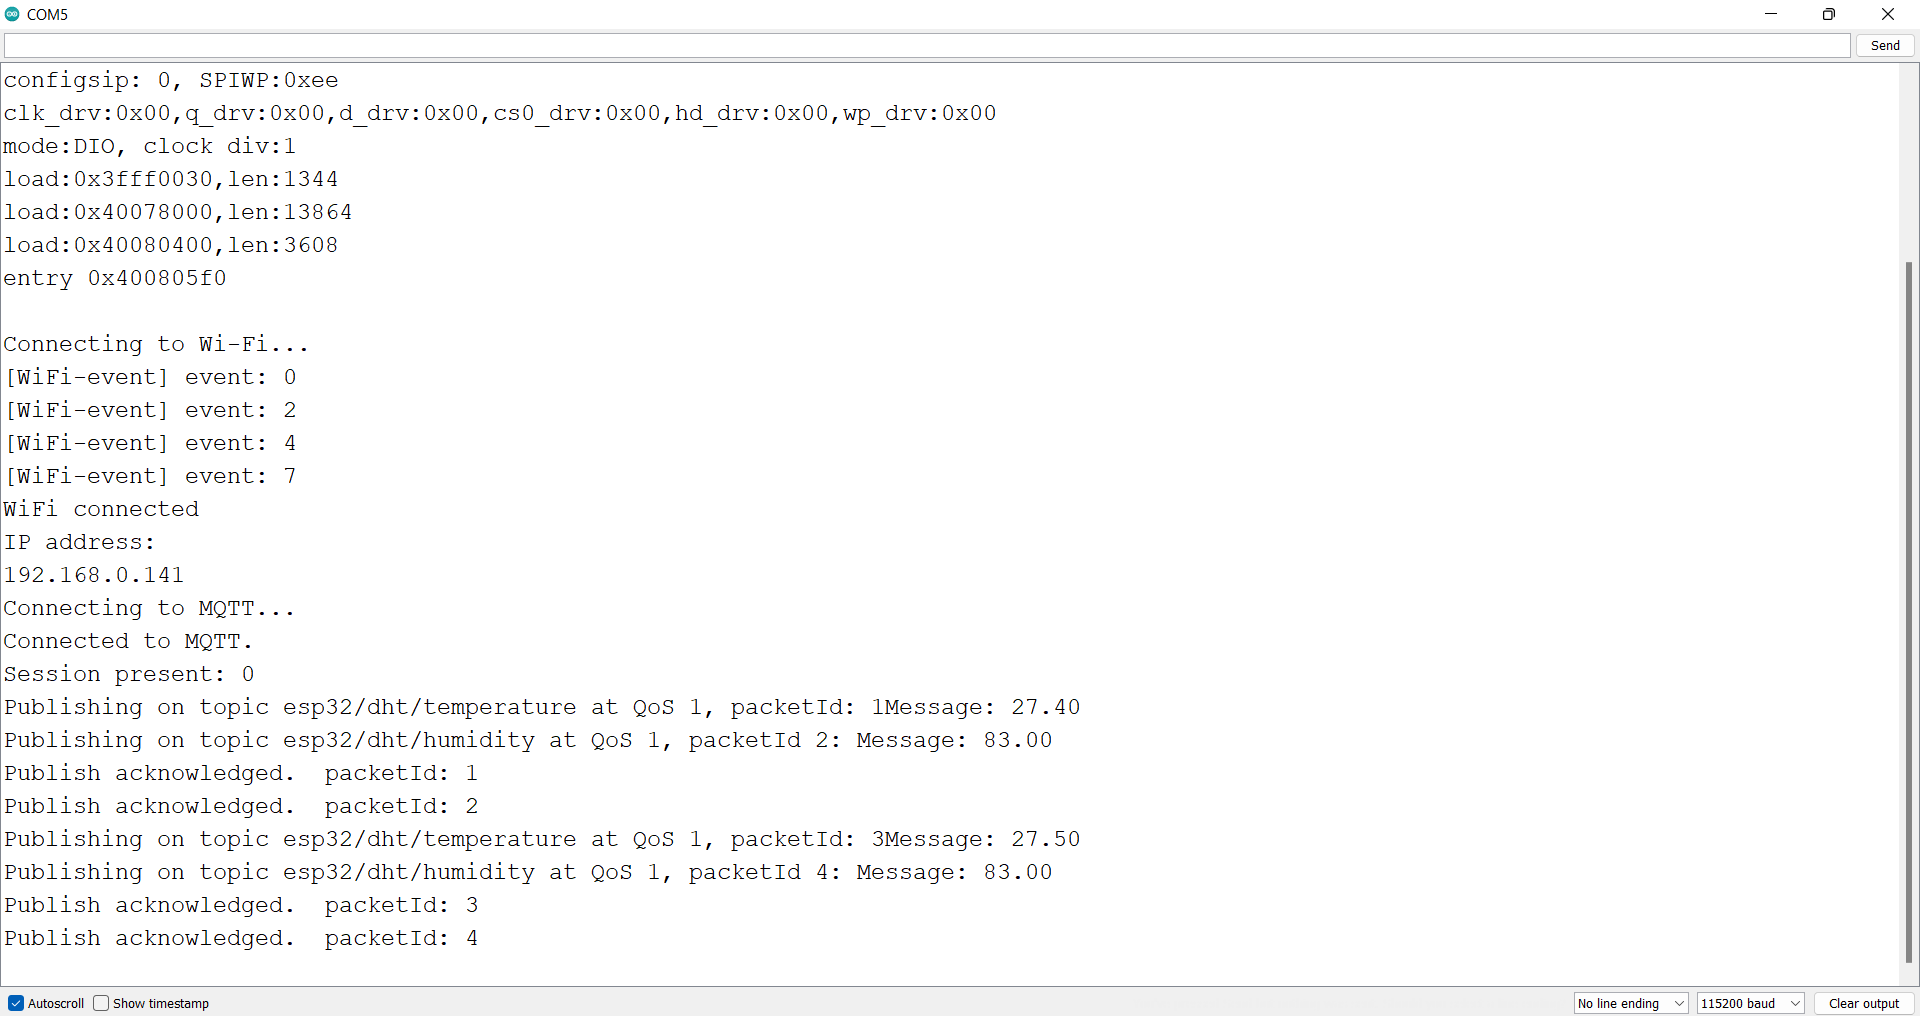
Upload the code to your ESP32. Open the serial monitor at a baud rate of 115200 and you’ll see that the ESP32 starts publishing messages on the topic we’ve defined previously.
Preparing Node-RED dashboard:
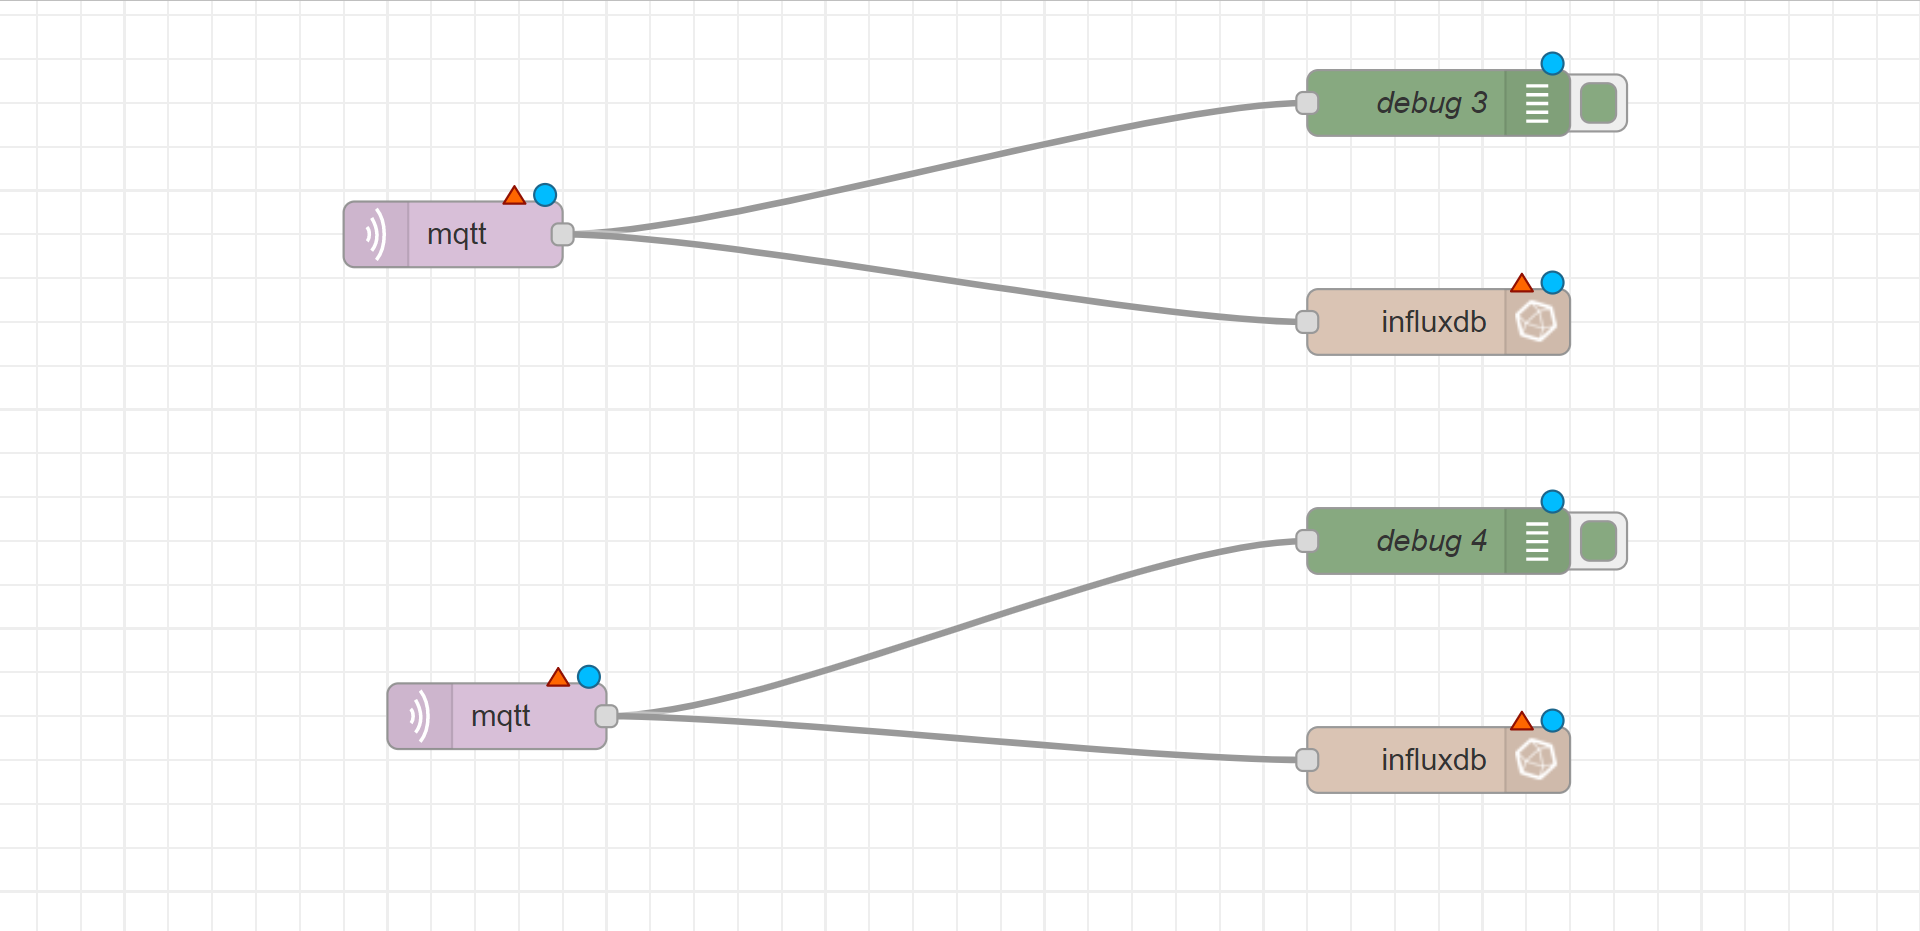
Now we need to store the data in Influx DB from Mosquitto MQTT so we are using Node Red for transmitting the data.
The ESP32 is publishing temperature readings every 10 seconds on the esp32/dht/temperature and esp32/dht/humidity topics. As an example, we’ll create a simple flow using Node-Red to subscribe to those topics and display the readings.
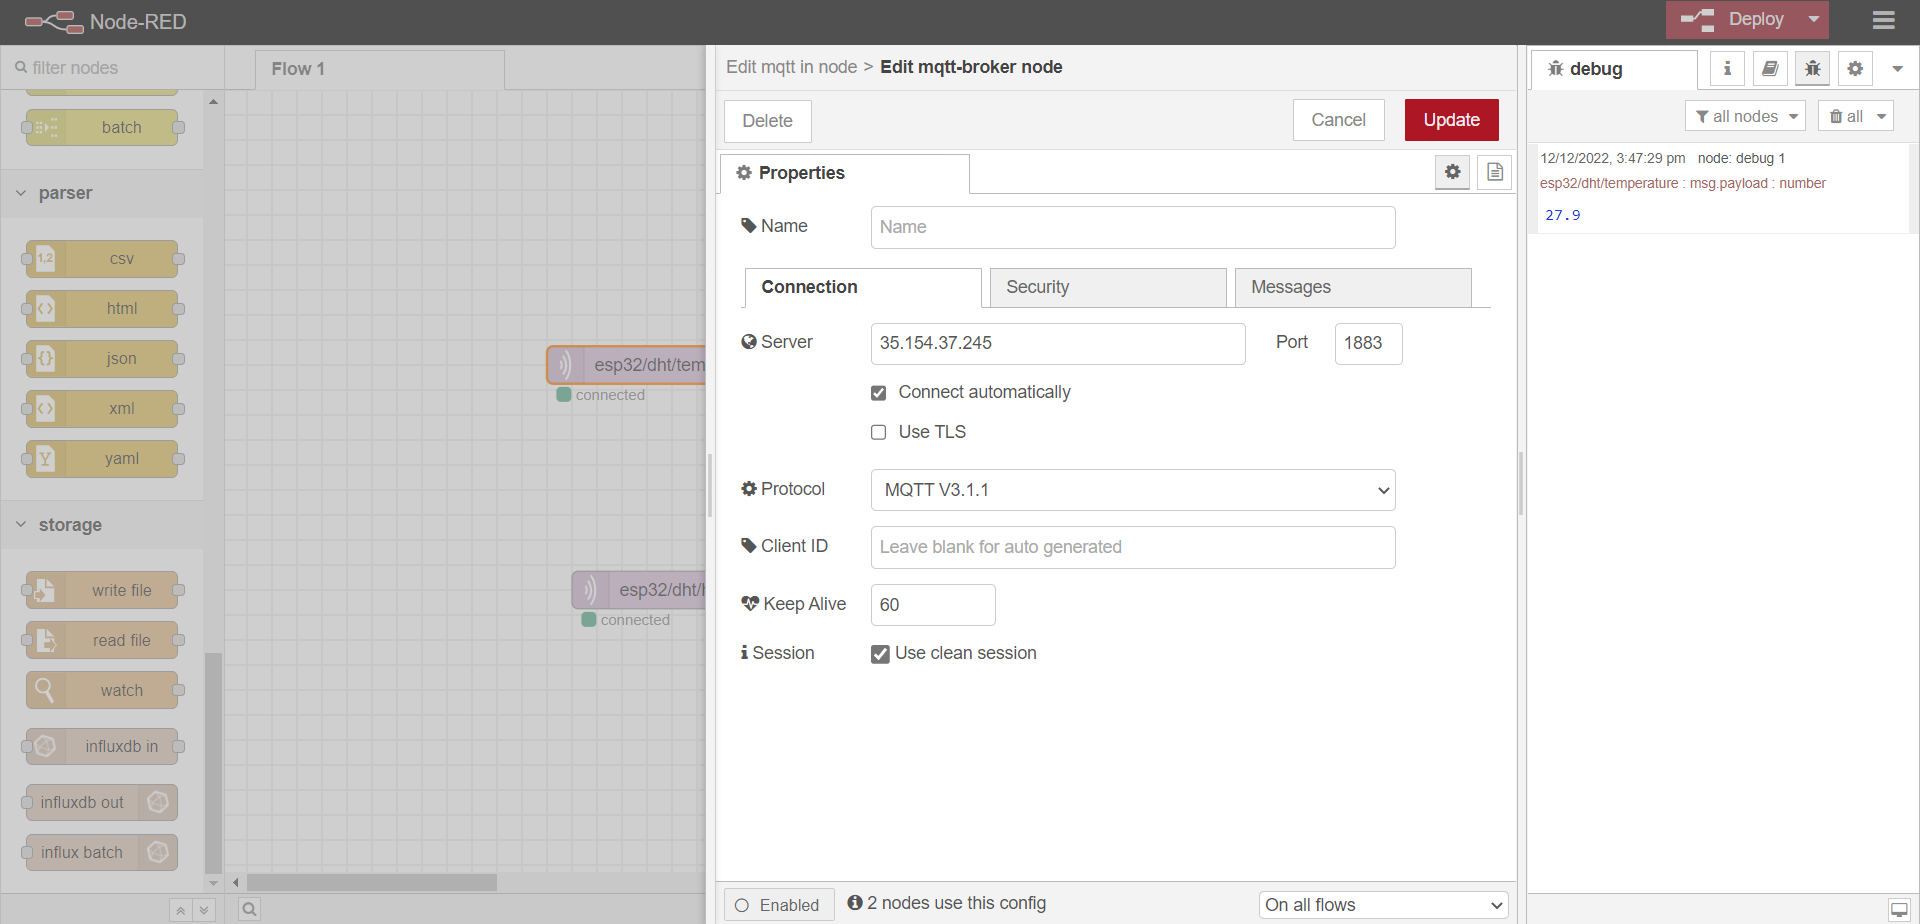
Click the MQTT IN node and edit its properties:
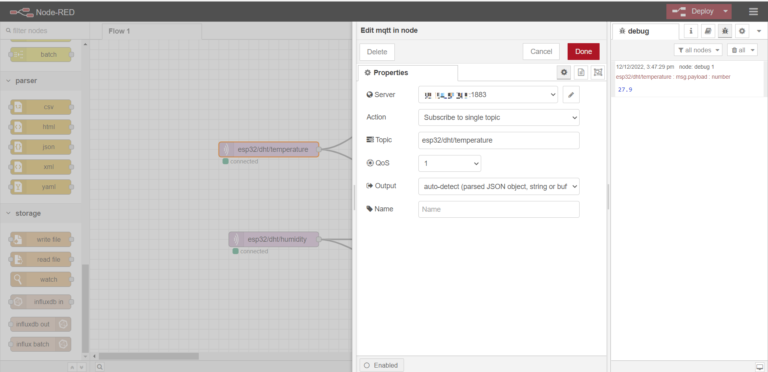
In the server field just copy the instance IP address. The localhost will be set default to 1883. Insert the topic you want to subscribe. Here we are using esp32/dht/temperature topic.
Click on the other MQTT IN node and edit its properties with the same server, but for the other topic: esp32/dht/humidity.
For editing the Influx DB output node follow the below steps.
Creating bucket in InfluxDB:
Login to your Influx DB, in the navigation menu on the left, click on bucket->create bucket and give a name for your bucket and click on create, your bucket will be successfully created.
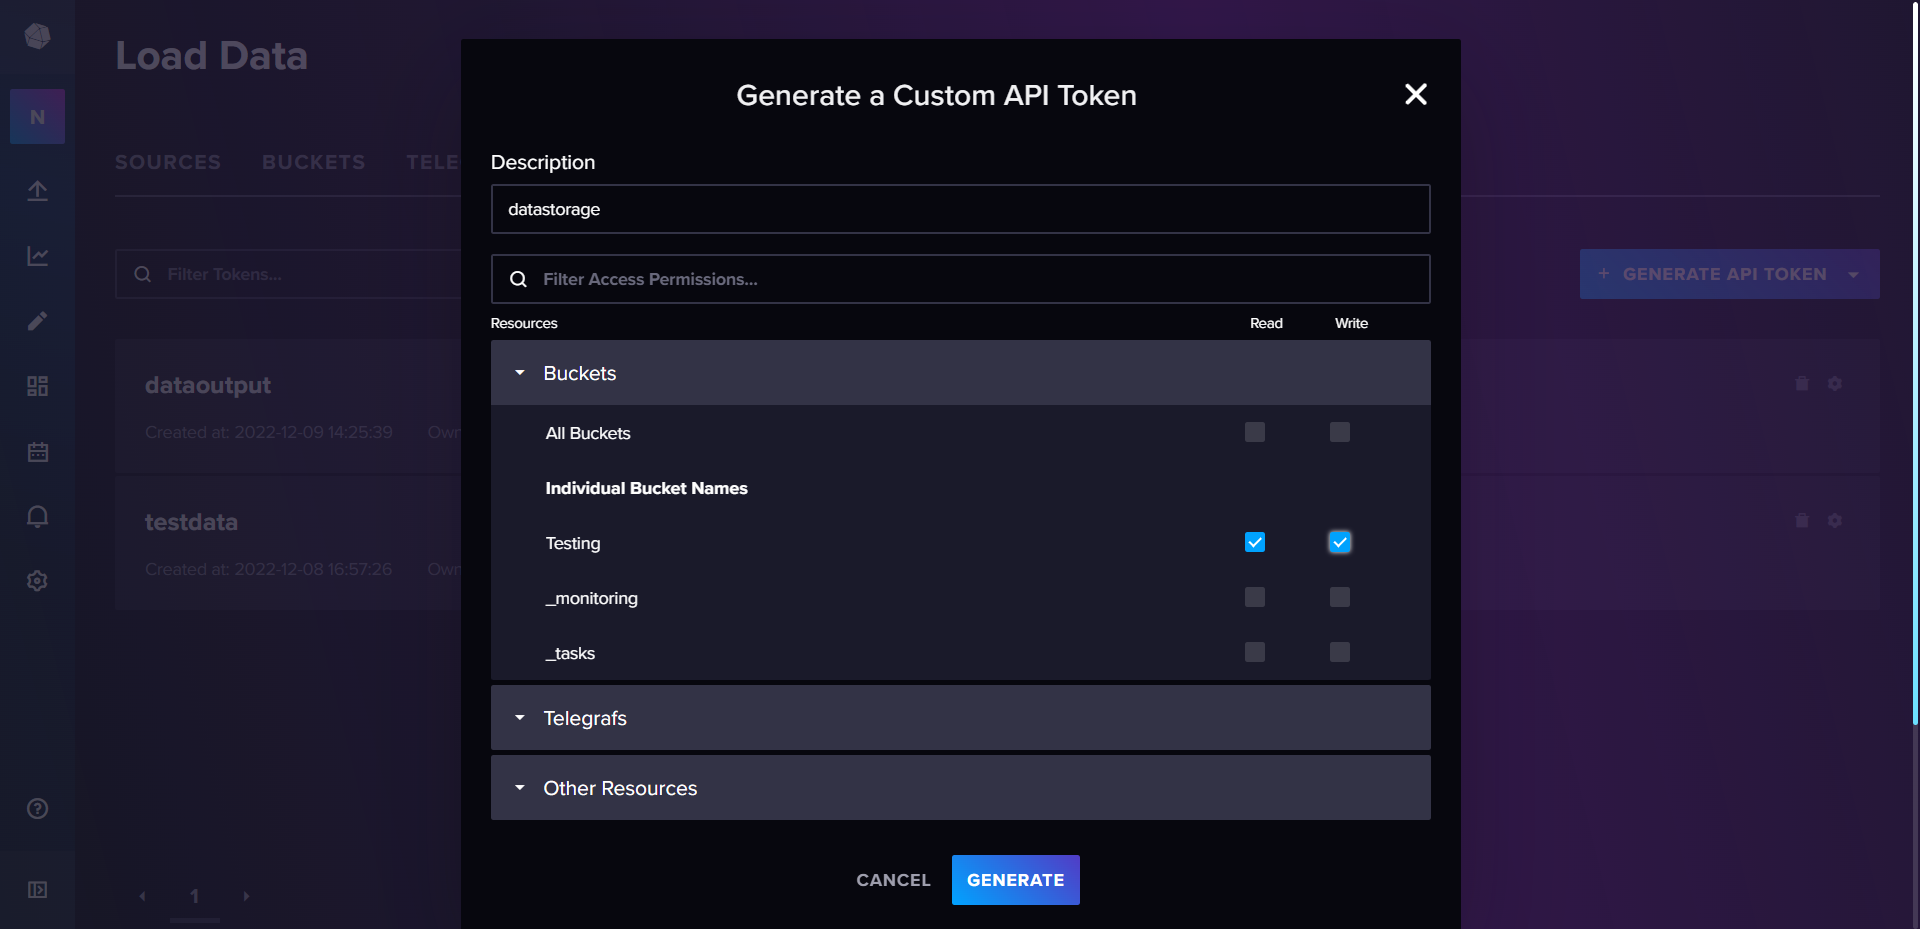
For generating API token click on API Tokens->custom API token create a description name and click on read and write option now click on generate you will be getting API token just copy the token and click on copy to board.
Now go back to Node-Red editor now click on Influx DB output node and edit its properties.
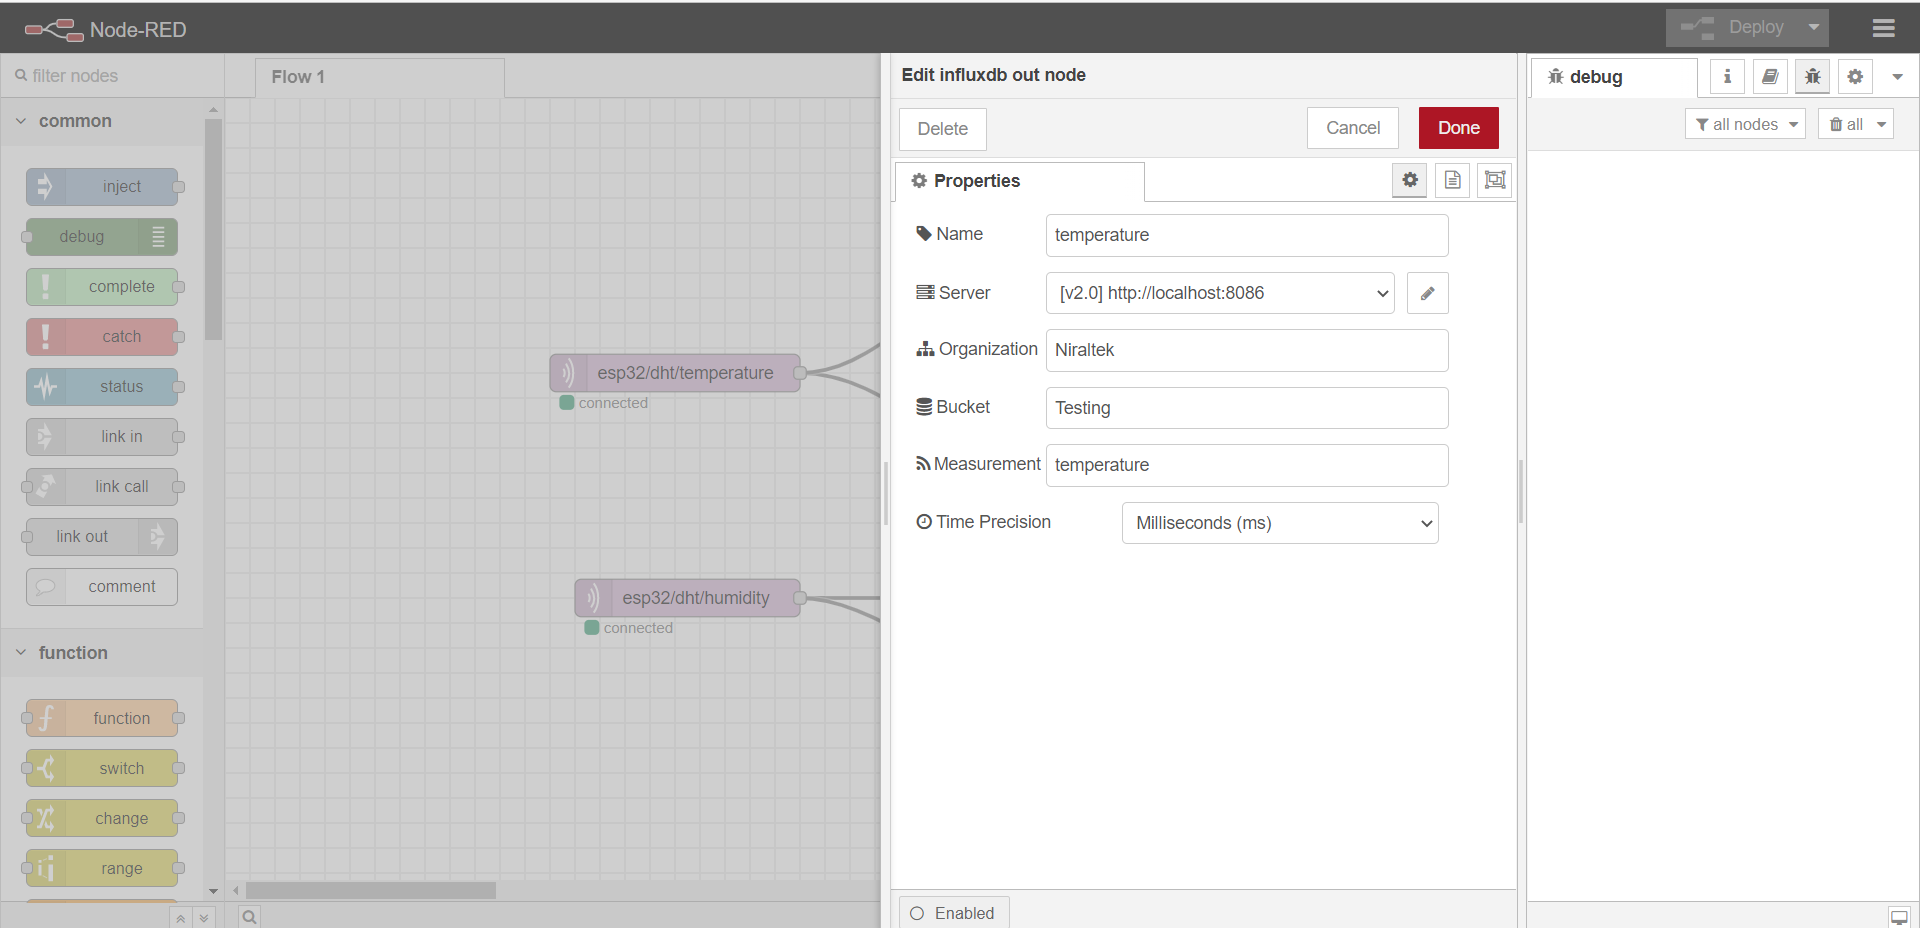
In the organization enter the organization name which you have created in the Influx DB then enter your bucket name. click on the server editor and paste the token which you have copied from Influx DB, Create your measurement and name.
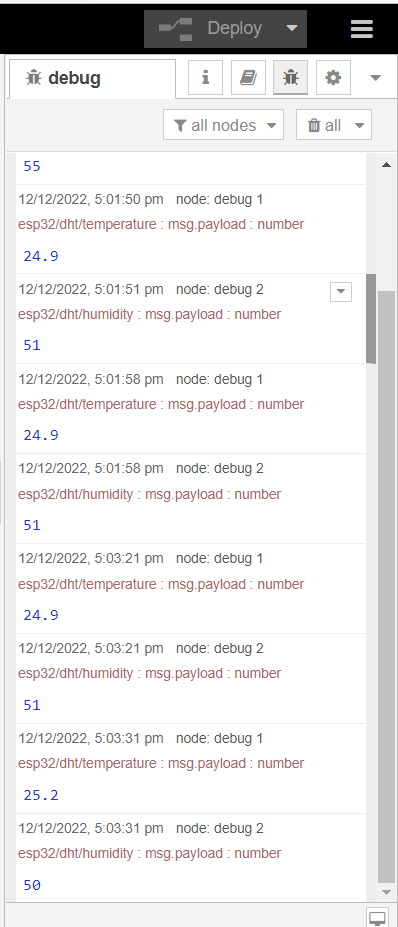
No need to make changes in the debug node, it will display the temperature and humidity reading.
Once the flow gets deployed and debugged the readings from Mosquitto MQTT will be displayed on Node Red.
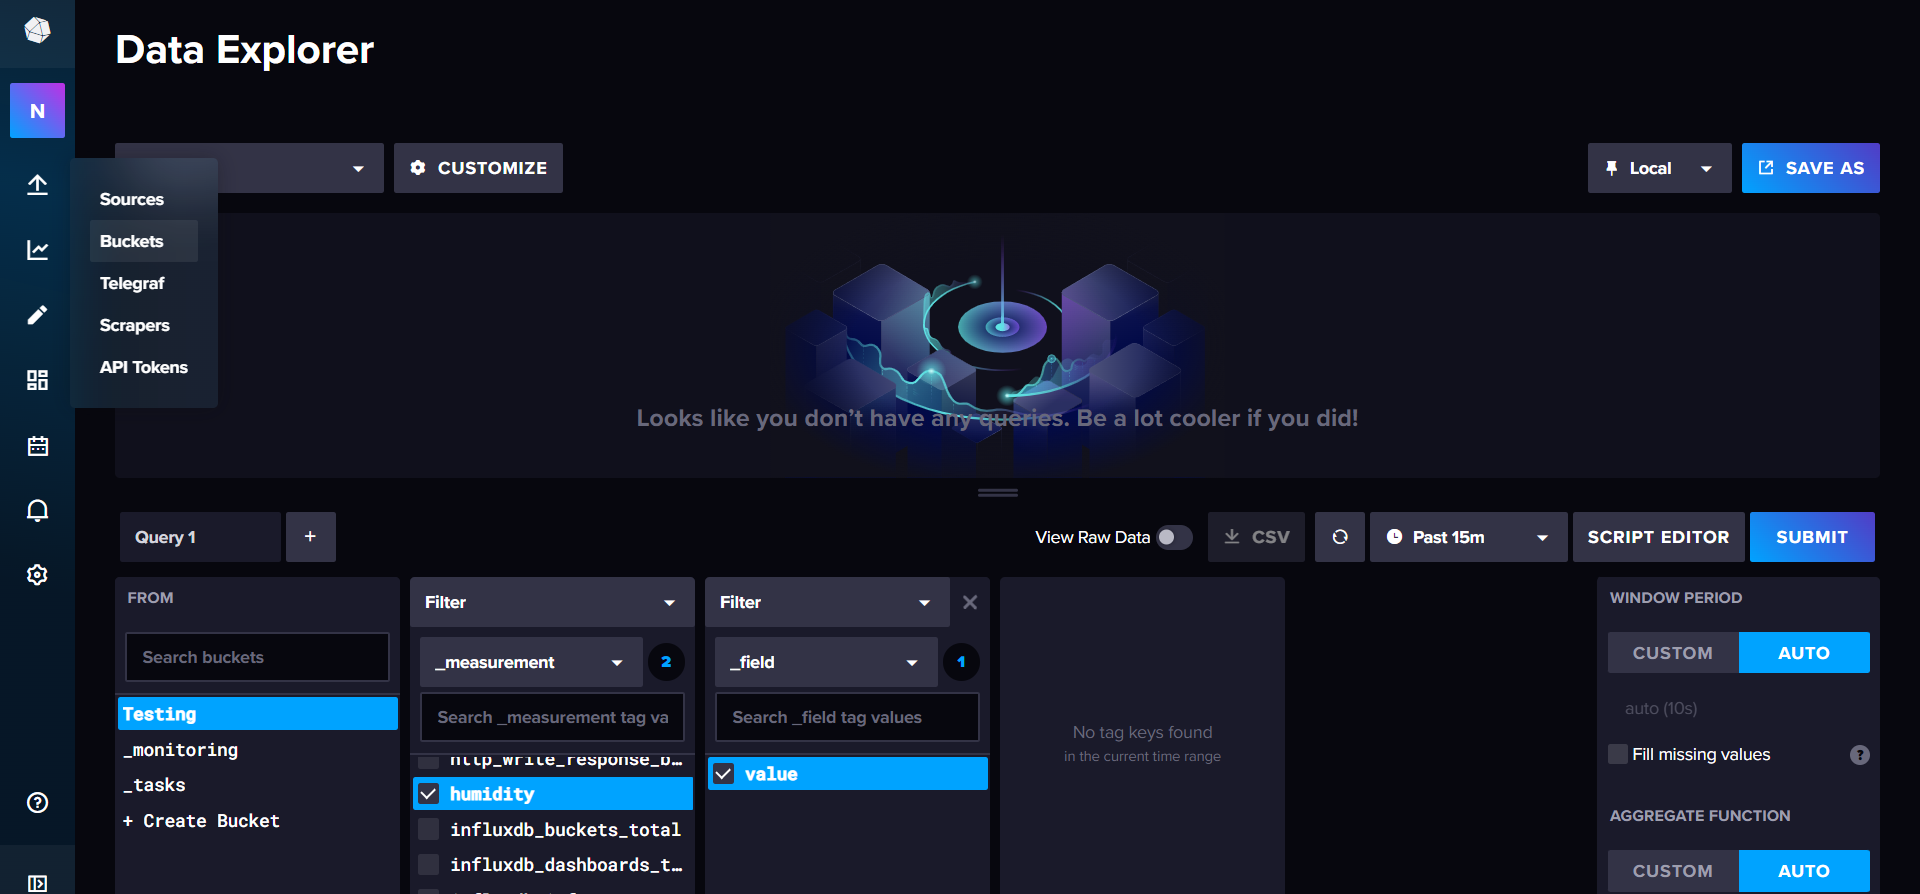
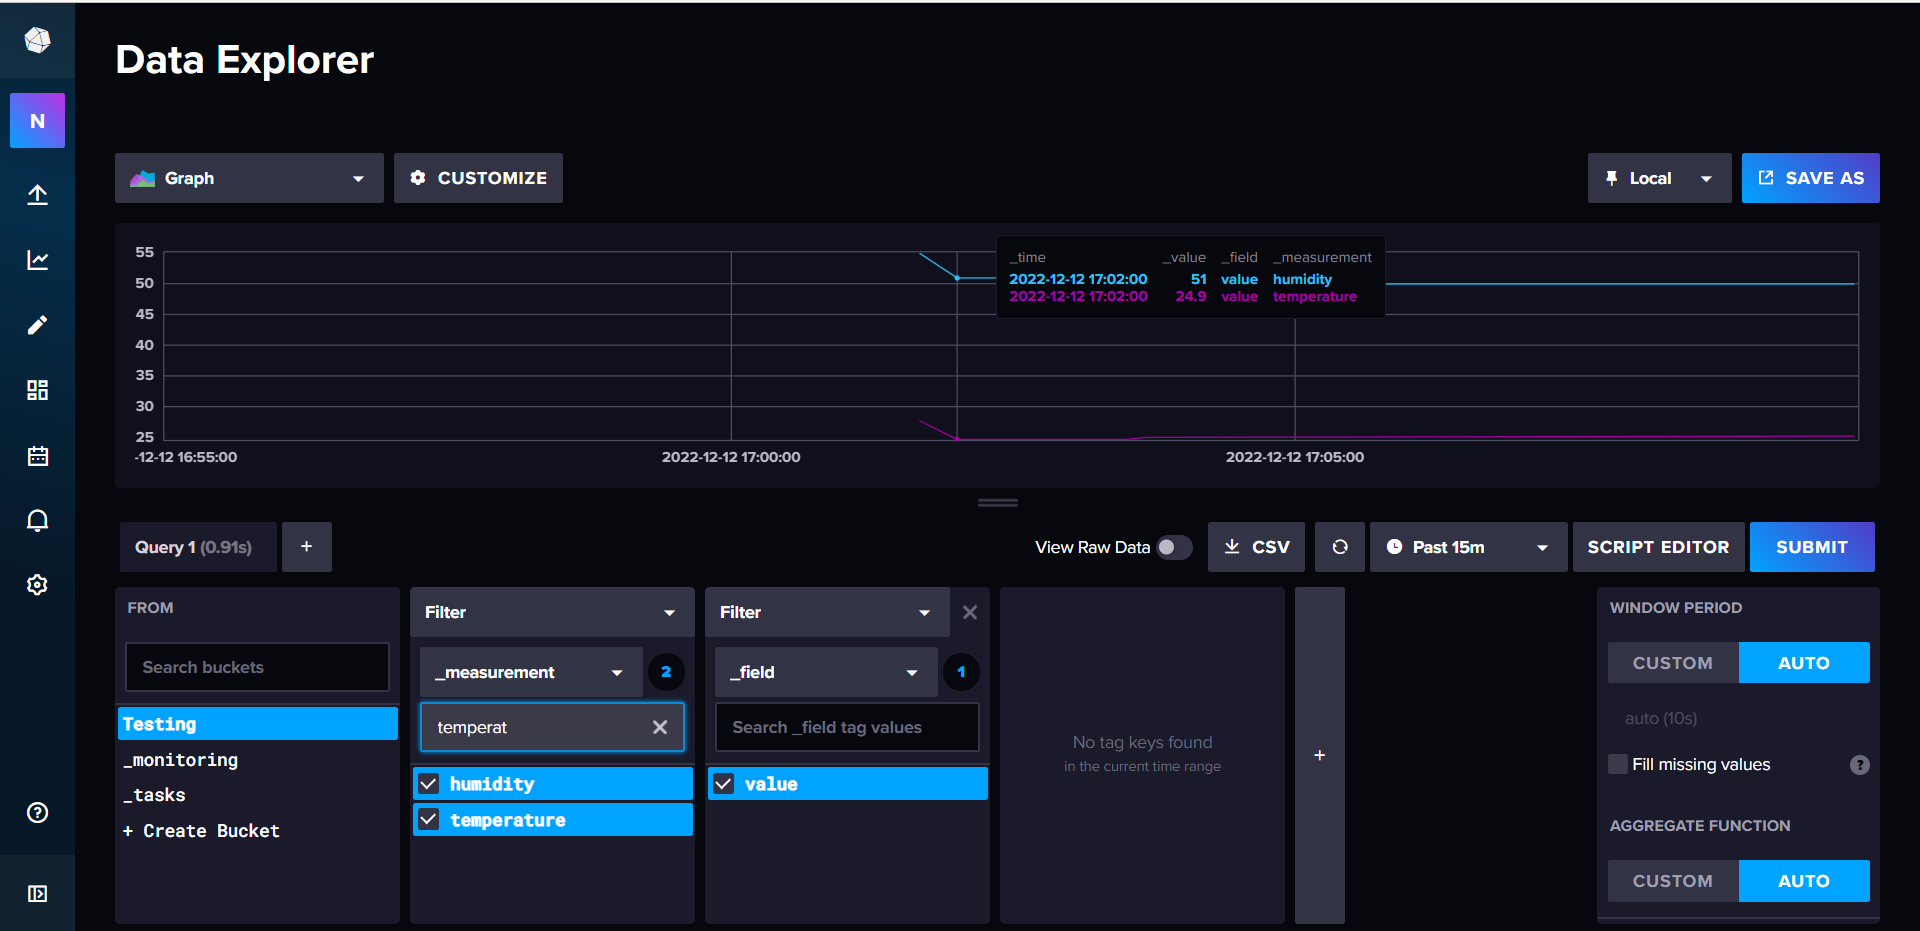
In Influx DB click on the bucket you have created and select measurement and value and click on submit.
GRAFANA:
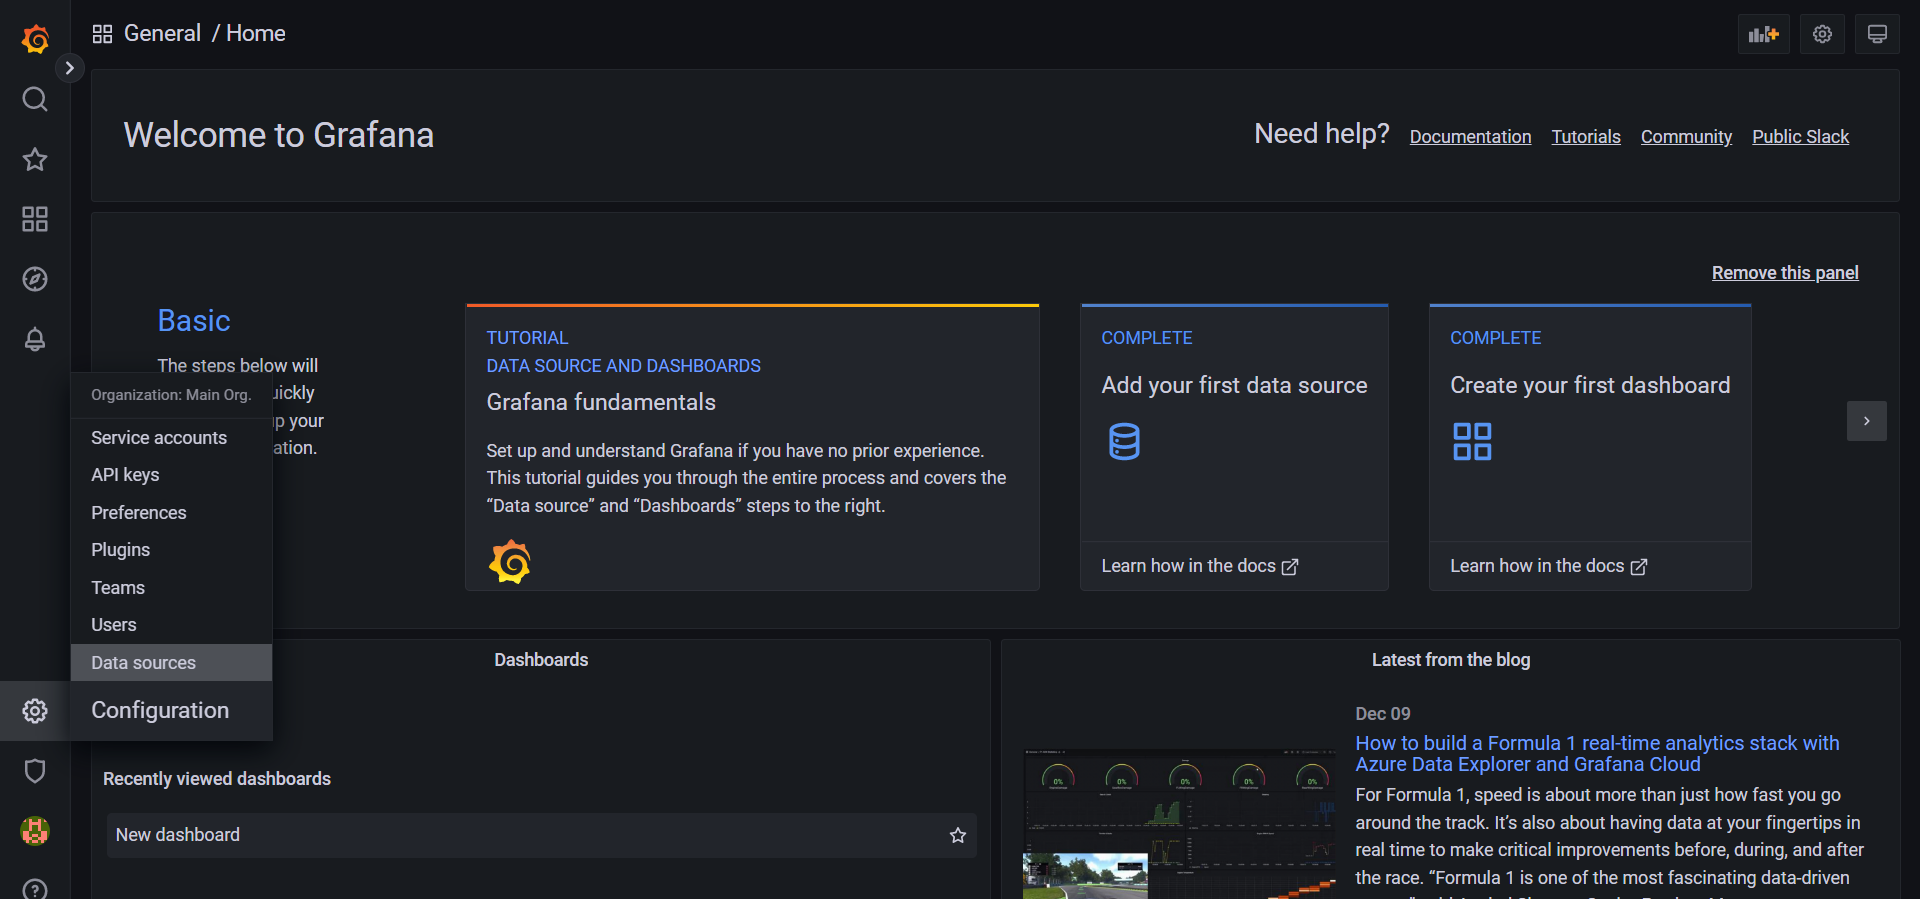
In Grafana click on configuration->Data source->Add data source->Influx DB
Changes to be made:
NAME: Give a name to your data source.
QUERY LANGUAGE: Select Flux.
HTTP URL: http://localhost:8086.
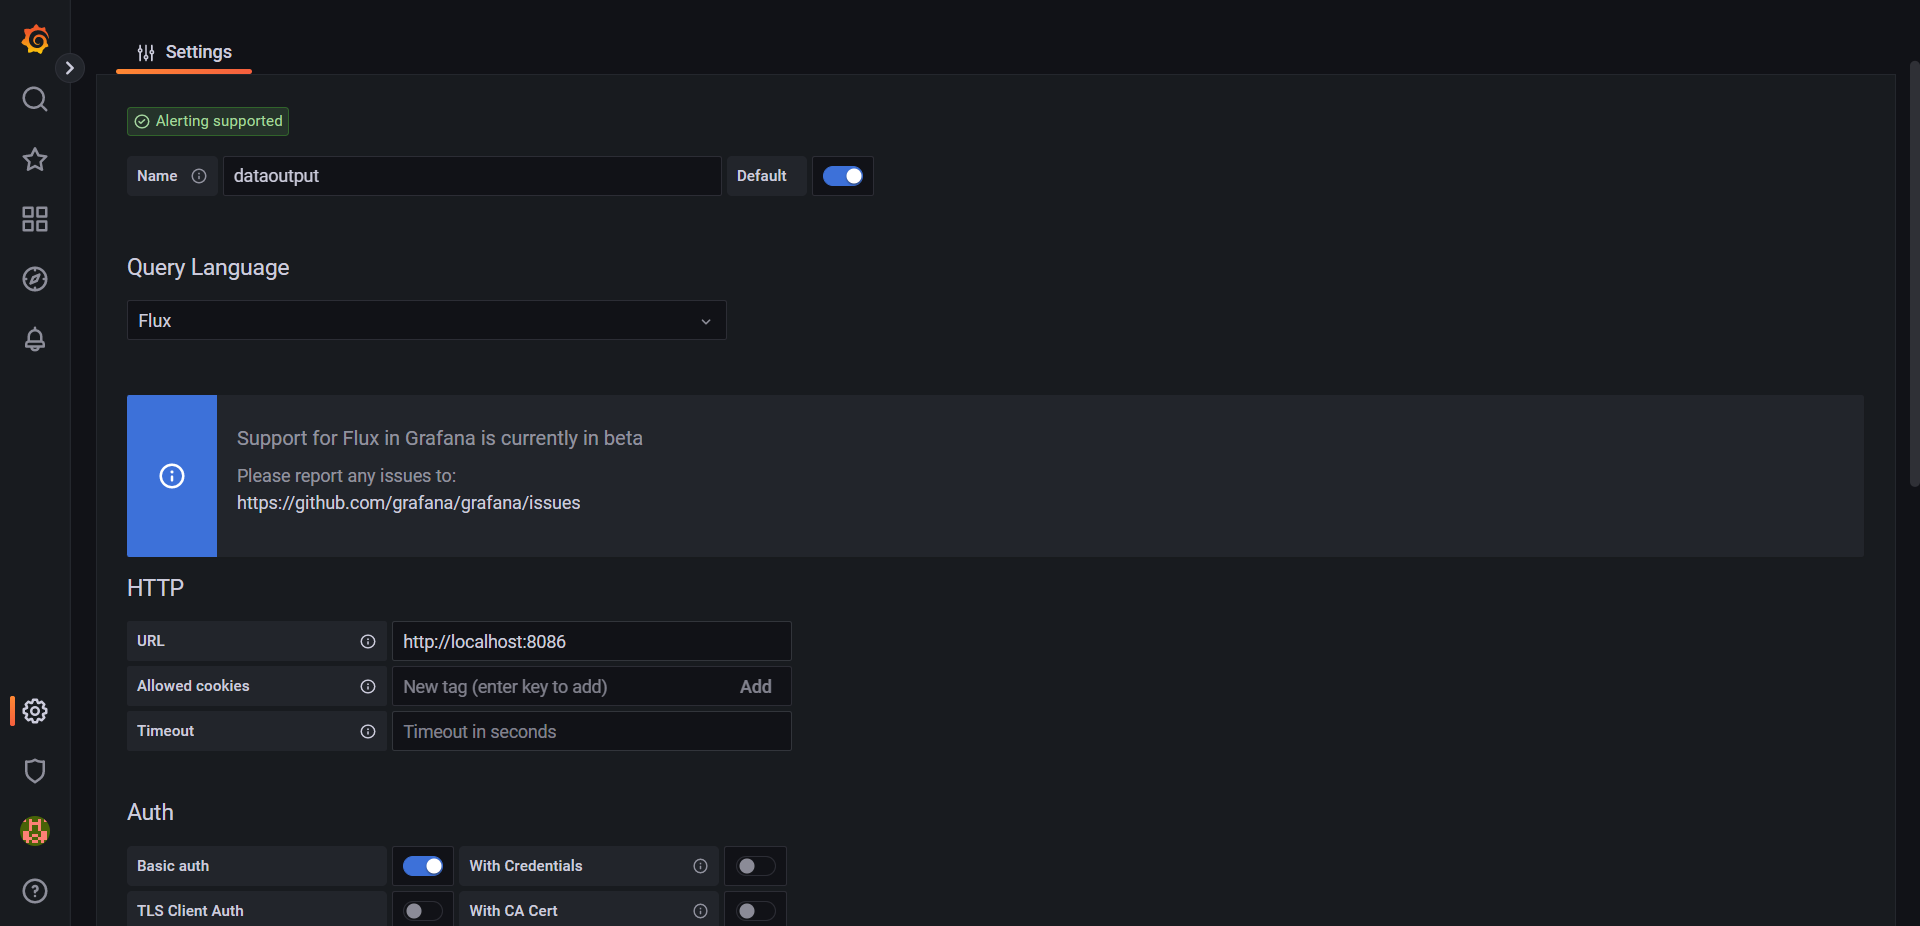
In basic auth details enter your username and password of Influx DB.
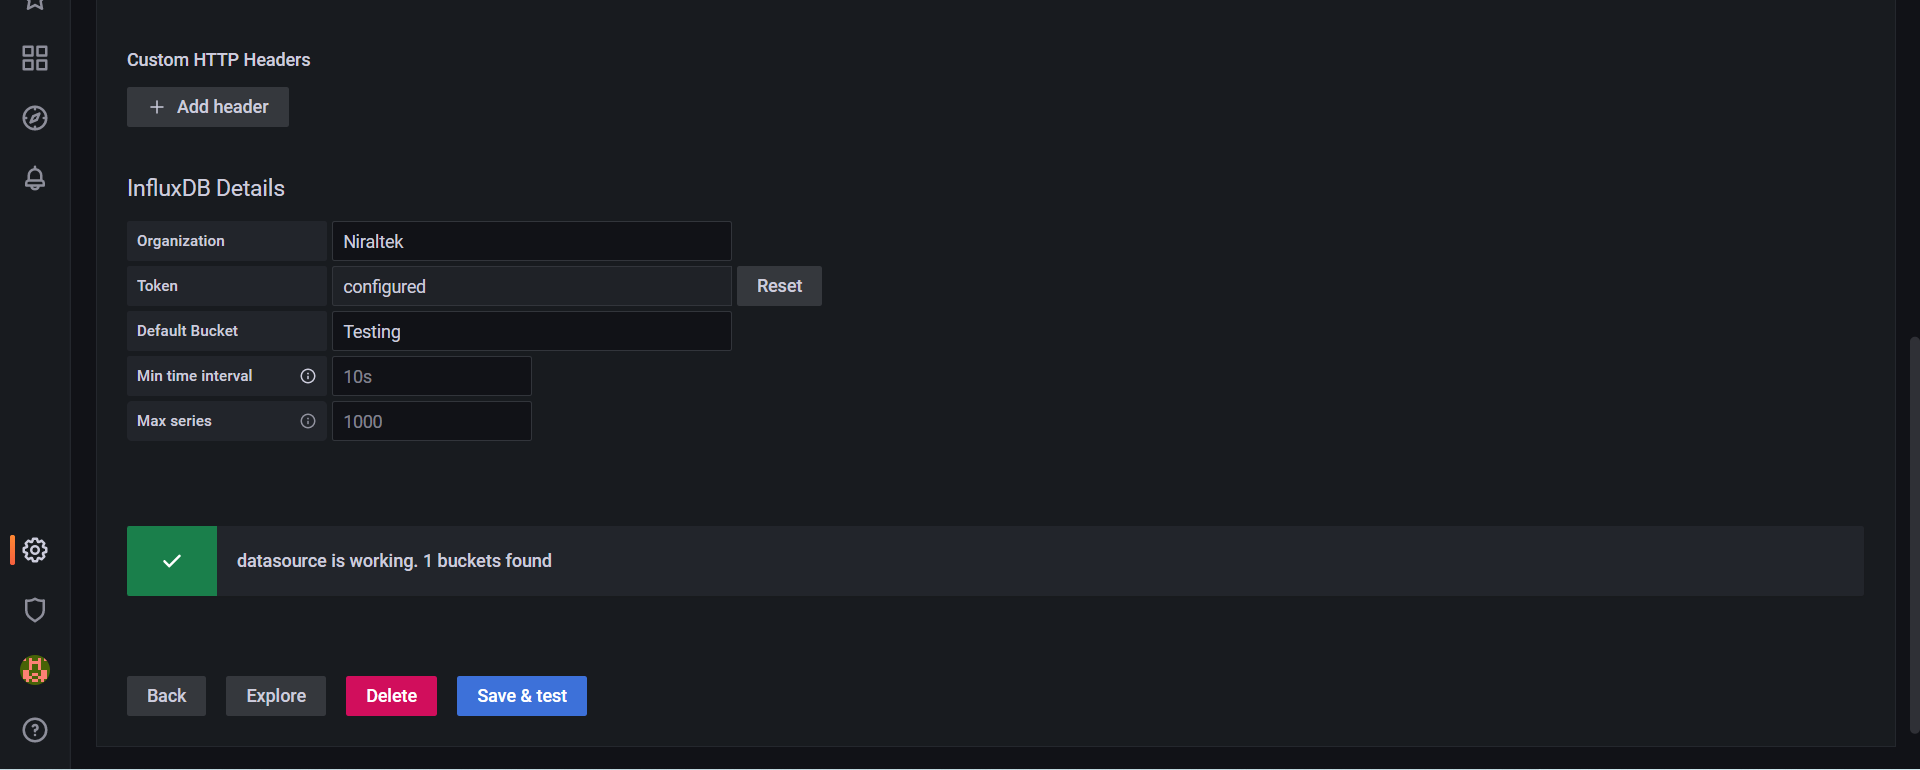
In Influx DB details:
ORGANIZATION: Organization name of Influx DB.
TOKEN: Paste the API Token from Influx DB.
DEFAULT BUCKET: Bucket name.
Now click on save and test, once clicked you will get the notification datasource is working. 1 bucket found.
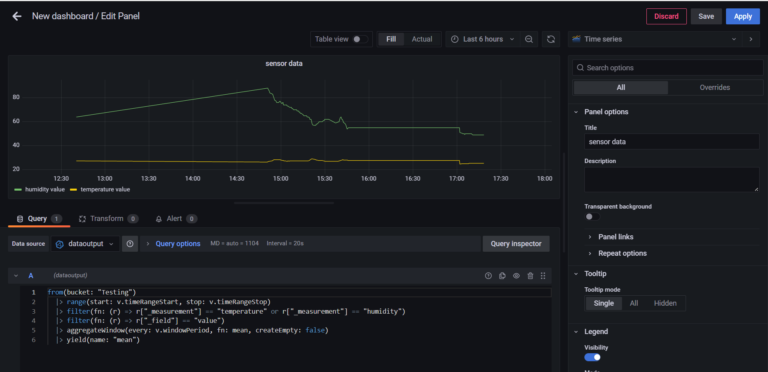
Now click on dashboards->new dashboard->Add a new panel.
Select the name which you have created for datasource. Copy and paste the script editor of Influx DB to Grafana give a tile name and click apply.
MQTT is a great communication protocol to exchange small amounts of data between devices. In this tutorial you’ve learned how to publish temperature and humidity readings from esp32(DHT 11) via MQTT to Node Red, Influx DB, Grafana.